Annual Report 2008 Sustainable design & engineering - Grontmij
Annual Report 2008 Sustainable design & engineering - Grontmij
Annual Report 2008 Sustainable design & engineering - Grontmij

Create successful ePaper yourself
Turn your PDF publications into a flip-book with our unique Google optimized e-Paper software.
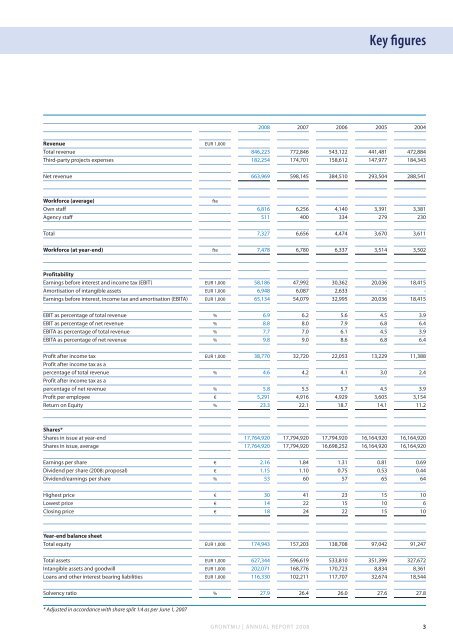
Key figures<br />
<strong>2008</strong> 2007 2006 2005 2004<br />
Revenue EUR 1,000<br />
Total revenue 846,223 772,846 543,122 441,481 472,884<br />
Third-party projects expenses 182,254 174,701 158,612 147,977 184,343<br />
Net revenue 663,969 598,145 384,510 293,504 288,541<br />
Workforce (average)<br />
fte<br />
Own staff 6,816 6,256 4,140 3,391 3,381<br />
Agency staff 511 400 334 279 230<br />
Total 7,327 6,656 4,474 3,670 3,611<br />
Workforce (at year-end) fte 7,478 6,780 6,337 3,514 3,502<br />
Profitability<br />
Earnings before interest and income tax (EBIT) EUR 1,000 58,186 47,992 30,362 20,036 18,415<br />
Amortisation of intangible assets EUR 1,000 6,948 6,087 2,633 - -<br />
Earnings before interest, income tax and amortisation (EBITA) EUR 1,000 65,134 54,079 32,995 20,036 18,415<br />
EBIT as percentage of total revenue % 6.9 6.2 5.6 4.5 3.9<br />
EBIT as percentage of net revenue % 8.8 8.0 7.9 6.8 6.4<br />
EBITA as percentage of total revenue % 7.7 7.0 6.1 4.5 3.9<br />
EBITA as percentage of net revenue % 9.8 9.0 8.6 6.8 6.4<br />
Profit after income tax EUR 1,000 38,770 32,720 22,053 13,229 11,388<br />
Profit after income tax as a<br />
percentage of total revenue % 4.6 4.2 4.1 3.0 2.4<br />
Profit after income tax as a<br />
percentage of net revenue % 5.8 5.5 5.7 4.5 3.9<br />
Profit per employee € 5,291 4,916 4,929 3,605 3,154<br />
Return on Equity % 23.3 22.1 18.7 14.1 11.2<br />
Shares*<br />
Shares in issue at year-end 17,764,920 17,794,920 17,794,920 16,164,920 16,164,920<br />
Shares in issue, average 17,764,920 17,794,920 16,698,252 16,164,920 16,164,920<br />
Earnings per share € 2.16 1.84 1.31 0.81 0.69<br />
Dividend per share (<strong>2008</strong>: proposal) € 1.15 1.10 0.75 0.53 0.44<br />
Dividend/earnings per share % 53 60 57 65 64<br />
Highest price € 30 41 23 15 10<br />
Lowest price € 14 22 15 10 6<br />
Closing price € 18 24 22 15 10<br />
Year-end balance sheet<br />
Total equity EUR 1,000 174,943 157,203 138,708 97,042 91,247<br />
Total assets EUR 1,000 627,344 596,619 533,810 351,399 327,672<br />
Intangible assets and goodwill EUR 1,000 202,071 168,776 170,723 8,834 8,361<br />
Loans and other interest bearing liabilities EUR 1,000 116,330 102,211 117,707 32,674 18,544<br />
Solvency ratio % 27.9 26.4 26.0 27.6 27.8<br />
* Adjusted in accordance with share split 1:4 as per June 1, 2007<br />
GRONTMIJ | ANNUAL REPORT <strong>2008</strong><br />
3