Annual Report 2008 Sustainable design & engineering - Grontmij
Annual Report 2008 Sustainable design & engineering - Grontmij
Annual Report 2008 Sustainable design & engineering - Grontmij

You also want an ePaper? Increase the reach of your titles
YUMPU automatically turns print PDFs into web optimized ePapers that Google loves.
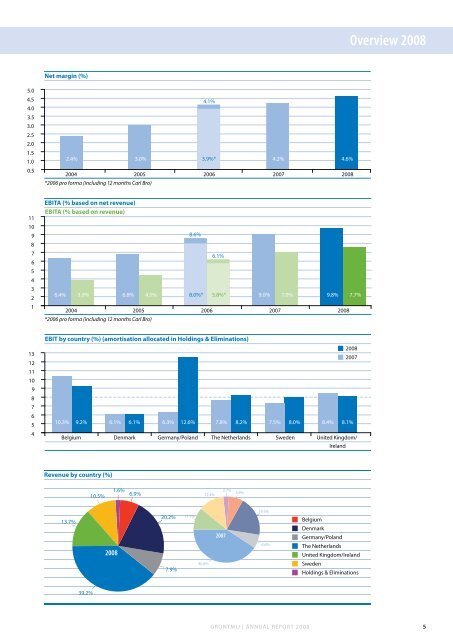
Overview <strong>2008</strong><br />
Net margin (%)<br />
5.0<br />
4.5<br />
4.0<br />
3.5<br />
3.0<br />
2.5<br />
2.0<br />
1.5<br />
1.0<br />
0.5<br />
4.1%<br />
2.4% 3.0%<br />
3.9%* 4.2% 4.6%<br />
2004 2005 2006 2007 <strong>2008</strong><br />
*2006 pro forma (including 12 months Carl Bro)<br />
11<br />
10<br />
9<br />
8<br />
7<br />
6<br />
5<br />
4<br />
3<br />
2<br />
1<br />
EBITA (% based on net revenue)<br />
In EBITA miljoen (% euro based on revenue)<br />
8.6%<br />
6.1%<br />
6.4% 3.9% 6.8% 4.5%<br />
8.0%* 5.8%*<br />
9.0% 7.0% 9.8% 7.7%<br />
2004 2005 2006 2007 <strong>2008</strong><br />
*2006 pro forma (including 12 months Carl Bro)<br />
13<br />
12<br />
11<br />
10<br />
9<br />
8<br />
7<br />
6<br />
5<br />
4<br />
EBIT by country (%) (amortisation allocated in Holdings & Eliminations)<br />
10.3% 9.2%<br />
6.1% 6.1% 6.3% 12.6% 7.8% 8.2% 7.5% 8.0% 8.4% 8.1%<br />
Belgium Denmark Germany/Poland The Netherlands Sweden United Kingdom/<br />
Ireland<br />
<strong>2008</strong><br />
2007<br />
Revenue by country (%)<br />
1.6%<br />
10.5% 6.9%<br />
12.4%<br />
2.7%<br />
6.9%<br />
13.7%<br />
<strong>2008</strong><br />
20.2%<br />
7.9%<br />
11.1%<br />
1%<br />
40.8%<br />
2007<br />
19.5%<br />
6.6%<br />
Belgium<br />
Denmark<br />
Germany/Poland<br />
The Netherlands<br />
United Kingdom/Ireland<br />
Sweden<br />
Holdings & Eliminations<br />
39.2%<br />
GRONTMIJ | ANNUAL REPORT <strong>2008</strong><br />
5