Annual Report 2008 Sustainable design & engineering - Grontmij
Annual Report 2008 Sustainable design & engineering - Grontmij
Annual Report 2008 Sustainable design & engineering - Grontmij

You also want an ePaper? Increase the reach of your titles
YUMPU automatically turns print PDFs into web optimized ePapers that Google loves.
Corporate Social Responsibility<br />
Verslag van de Raad van Bestuur<br />
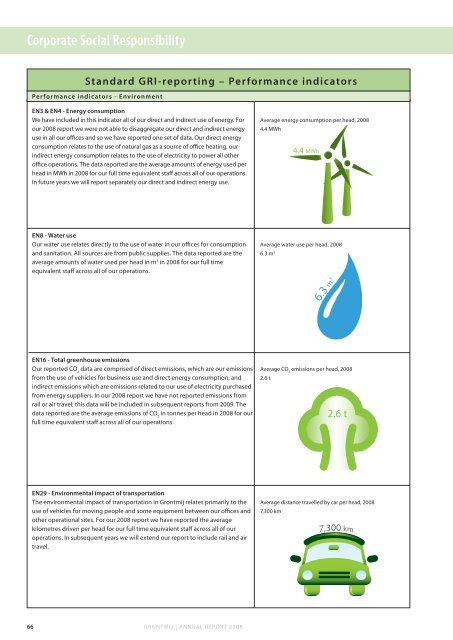
Standard GRI-reporting – Performance indicators<br />
Performance indicators - Environment<br />
EN3 & EN4 - Energy consumption<br />
We have included in this indicator all of our direct and indirect use of energy. For<br />
our <strong>2008</strong> report we were not able to disaggregate our direct and indirect energy<br />
use in all our offices and so we have reported one set of data. Our direct energy<br />
consumption relates to the use of natural gas as a source of office heating, our<br />
indirect energy consumption relates to the use of electricity to power all other<br />
office operations. The data reported are the average amounts of energy used per<br />
head in MWh in <strong>2008</strong> for our full time equivalent staff across all of our operations.<br />
In future years we will report separately our direct and indirect energy use.<br />
Average energy consumption per head, <strong>2008</strong><br />
4.4 MWh<br />
4.4 MWh<br />
EN8 - Water use<br />
Our water use relates directly to the use of water in our offices for consumption<br />
and sanitation. All sources are from public supplies. The data reported are the<br />
average amounts of water used per head in m 3 in <strong>2008</strong> for our full time<br />
equivalent staff across all of our operations.<br />
Average water use per head, <strong>2008</strong><br />
6.3 m 3<br />
EN16 - Total greenhouse emissions<br />
Our reported CO 2<br />
data are comprised of direct emissions, which are our emissions<br />
from the use of vehicles for business use and direct energy consumption, and<br />
indirect emissions which are emissions related to our use of electricity purchased<br />
from energy suppliers. In our <strong>2008</strong> report we have not reported emissions from<br />
rail or air travel; this data will be included in subsequent reports from 2009. The<br />
data reported are the average emissions of CO 2<br />
in tonnes per head in <strong>2008</strong> for our<br />
full time equivalent staff across all of our operations.<br />
Average CO 2<br />
emissions per head, <strong>2008</strong><br />
2.6 t<br />
2.6 t<br />
EN29 - Environmental impact of transportation<br />
The environmental impact of transportation in <strong>Grontmij</strong> relates primarily to the<br />
use of vehicles for moving people and some equipment between our offices and<br />
other operational sites. For our <strong>2008</strong> report we have reported the average<br />
kilometres driven per head for our full time equivalent staff across all of our<br />
operations. In subsequent years we will extend our report to include rail and air<br />
travel.<br />
Average distance travelled by car per head, <strong>2008</strong><br />
7,300 km<br />
66<br />
GRONTMIJ | ANNUAL REPORT <strong>2008</strong>