DI-770 Oscilloscope provides five virtual instruments in one
DI-770 Oscilloscope provides five virtual instruments in one
DI-770 Oscilloscope provides five virtual instruments in one

You also want an ePaper? Increase the reach of your titles
YUMPU automatically turns print PDFs into web optimized ePapers that Google loves.
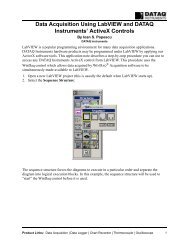
The way PC-based <strong>in</strong>strumentation should be<br />
<strong>DI</strong>-<strong>770</strong> and WINDAQ/Scope<br />
<strong>Oscilloscope</strong> and support<strong>in</strong>g software<br />
User's Manual<br />
Manual Revision F<br />
Software Release Level 1<br />
Copyright © 2005 by DATAQ Instruments, Inc. The Information conta<strong>in</strong>ed here<strong>in</strong> is the exclusive property of<br />
DATAQ Instruments, Inc., except as otherwise <strong>in</strong>dicated and shall not be reproduced, transmitted, transcribed, stored<br />
<strong>in</strong> a retrieval system, or translated <strong>in</strong>to any human or computer language, <strong>in</strong> any form or by any means, electronic,<br />
mechanical, magnetic, optical, chemical, manual, or otherwise without expressed written authorization from the company.<br />
The distribution of this material outside the company may occur only as authorized by the company <strong>in</strong> writ<strong>in</strong>g.<br />
DATAQ Instruments' hardware and software products are not designed to be used <strong>in</strong> the diagnosis and treatment of<br />
humans, nor are they to be used as critical comp<strong>one</strong>nts <strong>in</strong> any life-support systems whose failure to perform can reasonably<br />
be expected to cause significant <strong>in</strong>jury to humans.<br />
DATAQ, the DATAQ logo, and WINDAQ are registered trademarks of DATAQ Instruments, Inc. All rights reserved.<br />
DATAQ Instruments, Inc.<br />
241 Spr<strong>in</strong>gside Drive<br />
Akron, Ohio 44333 U.S.A.<br />
Teleph<strong>one</strong>: 330-668-1444<br />
Fax: 330-666-5434<br />
Designed and manufactured <strong>in</strong> the<br />
United States of America
Warranty and Service Policy<br />
Product Warranty<br />
DATAQ Instruments, Inc. warrants that this hardware will be free from defects <strong>in</strong> materials and workmanship under<br />
normal use and service for a period of <strong>one</strong> year from the date of shipment. DATAQ Instruments' obligations under<br />
this warranty shall not arise until the defective material is shipped freight prepaid to DATAQ Instruments. The only<br />
responsibility of DATAQ Instruments under this warranty is to repair or replace, at its discretion and on a free of<br />
charge basis, the defective material.<br />
This warranty does not extend to products that have been repaired or altered by persons other than DATAQ Instruments<br />
employees, or products that have been subjected to misuse, neglect, improper <strong>in</strong>stallation, or accident.<br />
DATAQ Instruments shall have no liability for <strong>in</strong>cidental or consequential damages of any k<strong>in</strong>d aris<strong>in</strong>g out of the sale,<br />
<strong>in</strong>stallation, or use of its products.<br />
Service Policy<br />
1. All products returned to DATAQ Instruments for service, regardless of warranty status, must be on a freight-prepaid<br />
basis.<br />
2. For <strong>in</strong>-warranty repairs, DATAQ Instruments will return repaired items to the buyer freight prepaid. Out of warranty<br />
repairs will be returned with freight prepaid and added to the service <strong>in</strong>voice.
<strong>DI</strong>-<strong>770</strong> and WINDAQ/Scope Manual<br />
Table of Contents<br />
Warranty and Service Policy ................................................................................................................ iii<br />
1. Introduction ....................................................................................................................................... 1<br />
ATTENTION! ................................................................................................................................... 1<br />
Safety ................................................................................................................................................. 1<br />
Sampl<strong>in</strong>g ............................................................................................................................................ 2<br />
Alias<strong>in</strong>g .............................................................................................................................................. 2<br />
Digitiz<strong>in</strong>g ........................................................................................................................................... 3<br />
The probes ......................................................................................................................................... 3<br />
2. Specifications ...................................................................................................................................... 5<br />
<strong>Oscilloscope</strong> ....................................................................................................................................... 5<br />
Voltmeter ........................................................................................................................................... 6<br />
Transient Recorder ............................................................................................................................ 6<br />
Spectrum Analyzer ............................................................................................................................ 6<br />
Arbitrary Waveform Generator ......................................................................................................... 7<br />
Acquisition System ............................................................................................................................ 7<br />
Arbitrary Waveform Generator (<strong>in</strong>dependent from acquisition system) ........................................... 7<br />
Trigger System .................................................................................................................................. 8<br />
Power Requirements .......................................................................................................................... 8<br />
Physical .............................................................................................................................................. 8<br />
I/O Connectors ................................................................................................................................... 8<br />
System Requirements ........................................................................................................................ 9<br />
Operat<strong>in</strong>g Environment ..................................................................................................................... 9<br />
Storage Environment ......................................................................................................................... 9<br />
Certifications and Compliances ......................................................................................................... 9<br />
Package .............................................................................................................................................. 9<br />
3. Installation ......................................................................................................................................... 11<br />
Requirements ..................................................................................................................................... 11<br />
Driver Installation .............................................................................................................................. 11<br />
Install<strong>in</strong>g W<strong>in</strong>Daq/Scope Software ................................................................................................... 12<br />
4. Connections ........................................................................................................................................ 13<br />
Extension connector .......................................................................................................................... 13<br />
External power ................................................................................................................................... 13<br />
5. W<strong>in</strong>Daq/Scope Software .................................................................................................................... 15<br />
Structure of the program .................................................................................................................... 19<br />
Start<strong>in</strong>g the program .......................................................................................................................... 19<br />
Help ................................................................................................................................................... 19<br />
Controll<strong>in</strong>g the <strong><strong>in</strong>struments</strong> ............................................................................................................... 19<br />
Keys that can be used .................................................................................................................. 20<br />
Controll<strong>in</strong>g with the mouse ......................................................................................................... 21<br />
Program setup .................................................................................................................................... 21<br />
Instrument taskbar always on top ................................................................................................ 21<br />
Sett<strong>in</strong>g display colors .................................................................................................................. 22<br />
Sett<strong>in</strong>g the application language ................................................................................................. 22<br />
Sett<strong>in</strong>g the location of files ......................................................................................................... 22<br />
Default text on the pr<strong>in</strong>ter output ................................................................................................ 22<br />
Device <strong>in</strong>fo .................................................................................................................................. 22<br />
Table of Contents<br />
v
<strong>DI</strong>-<strong>770</strong> and WINDAQ/Scope Manual<br />
Sett<strong>in</strong>g the date and time style .................................................................................................... 22<br />
Search hardware .......................................................................................................................... 22<br />
Manually adjust<strong>in</strong>g of calibration factors ................................................................................... 22<br />
Restore factory calibration factors .............................................................................................. 23<br />
Load<strong>in</strong>g a set of calibration values at start up ............................................................................. 23<br />
Select<strong>in</strong>g the type of duty cycle .................................................................................................. 23<br />
Active <strong><strong>in</strong>struments</strong> at start up ...................................................................................................... 23<br />
Sav<strong>in</strong>g <strong>in</strong>strument sett<strong>in</strong>gs on disk .................................................................................................... 24<br />
Restore <strong>in</strong>strument sett<strong>in</strong>gs from disk ............................................................................................... 24<br />
Stor<strong>in</strong>g measurement data on disk ..................................................................................................... 24<br />
Sett<strong>in</strong>g the data file type .............................................................................................................. 24<br />
Load<strong>in</strong>g saved measurement data from disk ..................................................................................... 25<br />
Sett<strong>in</strong>g the Waveform read method ............................................................................................. 25<br />
Compar<strong>in</strong>g signals us<strong>in</strong>g the reference channels ............................................................................... 26<br />
Fill the references ........................................................................................................................ 26<br />
Switch<strong>in</strong>g references on or off .................................................................................................... 26<br />
Scal<strong>in</strong>g references ....................................................................................................................... 26<br />
Update reference comment ......................................................................................................... 27<br />
Documentation of measurements ...................................................................................................... 27<br />
Add comment text to a measurement .......................................................................................... 27<br />
Place a comment label ................................................................................................................. 27<br />
Edit a comment label ................................................................................................................... 27<br />
Delet<strong>in</strong>g a comment label ............................................................................................................ 28<br />
Make a hard copy pr<strong>in</strong>t out ......................................................................................................... 28<br />
End<strong>in</strong>g the program ........................................................................................................................... 28<br />
6. The <strong>Oscilloscope</strong> ................................................................................................................................ 29<br />
Alias<strong>in</strong>g .............................................................................................................................................. 30<br />
Display<strong>in</strong>g channels ........................................................................................................................... 30<br />
Envelope mode ............................................................................................................................ 30<br />
Averag<strong>in</strong>g .................................................................................................................................... 31<br />
Math mode .................................................................................................................................. 31<br />
Sett<strong>in</strong>g up a channel ........................................................................................................................... 32<br />
Sett<strong>in</strong>g the sensitivity of a channel .............................................................................................. 32<br />
Sett<strong>in</strong>g the signal coupl<strong>in</strong>g of a channel ..................................................................................... 32<br />
Sett<strong>in</strong>g the vertical position of a channel .................................................................................... 33<br />
Magnify<strong>in</strong>g or reduc<strong>in</strong>g the vertical axis .................................................................................... 33<br />
Invert<strong>in</strong>g a channel ...................................................................................................................... 33<br />
The channel view button ............................................................................................................. 34<br />
Chang<strong>in</strong>g the units of the vertical axis ........................................................................................ 34<br />
Mouse sensitivity for the vertical axis ........................................................................................ 35<br />
Sett<strong>in</strong>g up the time axis ...................................................................................................................... 35<br />
Sett<strong>in</strong>g the sample frequency ...................................................................................................... 35<br />
Sett<strong>in</strong>g the record length ............................................................................................................. 35<br />
Sett<strong>in</strong>g the pre trigger value ........................................................................................................ 36<br />
Mouse sensitivity pre trigger position adjustment ...................................................................... 36<br />
Magnify<strong>in</strong>g the horizontal axis ................................................................................................... 37<br />
Sett<strong>in</strong>g the horizontal position of the signal(s) ........................................................................... 37<br />
The record view scroll bar ........................................................................................................... 37<br />
Trigger<strong>in</strong>g .......................................................................................................................................... 38<br />
Select<strong>in</strong>g the trigger source ......................................................................................................... 38<br />
Table of Contents<br />
vi
<strong>DI</strong>-<strong>770</strong> and WINDAQ/Scope Manual<br />
Select<strong>in</strong>g the trigger mode .......................................................................................................... 39<br />
Sett<strong>in</strong>g the trigger level ............................................................................................................... 39<br />
Sett<strong>in</strong>g the trigger hysteresis ....................................................................................................... 39<br />
The trigger symbol ...................................................................................................................... 39<br />
The trigger time out ..................................................................................................................... 40<br />
Perform<strong>in</strong>g measurements ................................................................................................................. 40<br />
Stopp<strong>in</strong>g the measurements ........................................................................................................ 40<br />
Perform Auto disk measurements ............................................................................................... 41<br />
Auto setup ................................................................................................................................... 41<br />
Zoom<strong>in</strong>g ............................................................................................................................................. 42<br />
Perform<strong>in</strong>g cursor measurements ...................................................................................................... 42<br />
Switch<strong>in</strong>g on cursors ................................................................................................................... 42<br />
Sett<strong>in</strong>g up the cursor measurements ............................................................................................ 42<br />
Select<strong>in</strong>g the active channel ........................................................................................................ 44<br />
Show<strong>in</strong>g or hid<strong>in</strong>g the cursor readout ......................................................................................... 44<br />
Switch<strong>in</strong>g off cursors .................................................................................................................. 44<br />
7. The Voltmeter .................................................................................................................................... 45<br />
The measure system of the voltmeter ................................................................................................ 45<br />
Sett<strong>in</strong>g the frequency range ......................................................................................................... 46<br />
Display<strong>in</strong>g channels ........................................................................................................................... 46<br />
Sett<strong>in</strong>g up a channel ........................................................................................................................... 46<br />
Sett<strong>in</strong>g the <strong>in</strong>put range ................................................................................................................ 46<br />
Sett<strong>in</strong>g the <strong>in</strong>put coupl<strong>in</strong>g ........................................................................................................... 47<br />
Sett<strong>in</strong>g a DC hardware offset ...................................................................................................... 47<br />
Configur<strong>in</strong>g the displays .................................................................................................................... 48<br />
Switch<strong>in</strong>g displays on and off ..................................................................................................... 48<br />
Switch<strong>in</strong>g bargraphs on and off .................................................................................................. 48<br />
Process<strong>in</strong>g the measured value ................................................................................................... 49<br />
Display<strong>in</strong>g the calculated value .................................................................................................. 50<br />
Change the units of measure ....................................................................................................... 51<br />
Change the units per measurement unit ...................................................................................... 51<br />
Relative measurements ............................................................................................................... 51<br />
Comparison measurements ......................................................................................................... 52<br />
Sett<strong>in</strong>g the reference impedance ................................................................................................. 52<br />
Sett<strong>in</strong>g the number of digits after the decimal separator ............................................................ 52<br />
Sound sett<strong>in</strong>gs ............................................................................................................................. 52<br />
Resett<strong>in</strong>g the m<strong>in</strong>imum and maximum values .................................................................................. 53<br />
Perform<strong>in</strong>g measurements ................................................................................................................. 53<br />
Start and stop measur<strong>in</strong>g ............................................................................................................. 53<br />
Averag<strong>in</strong>g .................................................................................................................................... 53<br />
Fast measur<strong>in</strong>g ............................................................................................................................ 53<br />
One shot measurements .............................................................................................................. 53<br />
Stor<strong>in</strong>g measurement values on disk or paper ................................................................................... 54<br />
Sett<strong>in</strong>g the time between two measurements .............................................................................. 54<br />
Sett<strong>in</strong>g the hysteresis ................................................................................................................... 54<br />
Start an acquisition ...................................................................................................................... 54<br />
8. The Data Logger ................................................................................................................................ 55<br />
The data logger measur<strong>in</strong>g system .................................................................................................... 55<br />
Display<strong>in</strong>g channels ........................................................................................................................... 56<br />
Sett<strong>in</strong>g up a channel ........................................................................................................................... 56<br />
Table of Contents<br />
vii
<strong>DI</strong>-<strong>770</strong> and WINDAQ/Scope Manual<br />
Sett<strong>in</strong>g up the time axis ...................................................................................................................... 56<br />
Sett<strong>in</strong>g up the sample speed ........................................................................................................ 56<br />
Sett<strong>in</strong>g the record length ............................................................................................................. 57<br />
Sett<strong>in</strong>g the horizontal axis type ................................................................................................... 57<br />
Perform measurements ...................................................................................................................... 57<br />
Start measur<strong>in</strong>g ............................................................................................................................ 57<br />
Stop measur<strong>in</strong>g ............................................................................................................................ 58<br />
Scroll mode ................................................................................................................................. 58<br />
Compar<strong>in</strong>g signals us<strong>in</strong>g the reference channels ............................................................................... 58<br />
Perform<strong>in</strong>g cursor measurements ...................................................................................................... 58<br />
9. The Spectrum Analyzer .................................................................................................................... 59<br />
Description of FFT ............................................................................................................................ 60<br />
Alias<strong>in</strong>g ....................................................................................................................................... 60<br />
W<strong>in</strong>dow<strong>in</strong>g .................................................................................................................................. 61<br />
Display<strong>in</strong>g channels ........................................................................................................................... 61<br />
Sett<strong>in</strong>g up a channel ........................................................................................................................... 62<br />
Sett<strong>in</strong>g the <strong>in</strong>put sensitivity ......................................................................................................... 62<br />
Logarithmic or l<strong>in</strong>ear vertical axis .............................................................................................. 62<br />
Sett<strong>in</strong>g up the frequency range .......................................................................................................... 63<br />
Sett<strong>in</strong>g up the frequency axis type ..................................................................................................... 63<br />
Sett<strong>in</strong>g the frequency range ......................................................................................................... 65<br />
Sett<strong>in</strong>g the spectrum record length .............................................................................................. 65<br />
Sett<strong>in</strong>g up the FFT ............................................................................................................................. 65<br />
FFT w<strong>in</strong>dow function .................................................................................................................. 65<br />
Perform<strong>in</strong>g measurements ................................................................................................................. 66<br />
Start and stop measur<strong>in</strong>g ............................................................................................................. 66<br />
S<strong>in</strong>gle measurements ................................................................................................................... 66<br />
Averag<strong>in</strong>g .................................................................................................................................... 66<br />
Measur<strong>in</strong>g maximum values ....................................................................................................... 66<br />
Measure the Total Harmonic Distortion of a signal .................................................................... 67<br />
Perform<strong>in</strong>g cursor measurements ...................................................................................................... 67<br />
Sett<strong>in</strong>g up the cursor measurements ............................................................................................ 67<br />
10. The Function Generator ................................................................................................................. 69<br />
Pr<strong>in</strong>ciple of the function generator .................................................................................................... 69<br />
Structure of the function generator .................................................................................................... 69<br />
Controll<strong>in</strong>g the function generator ..................................................................................................... 70<br />
Signal shape ................................................................................................................................ 70<br />
Frequency .................................................................................................................................... 70<br />
Symmetry .................................................................................................................................... 70<br />
Amplitude .................................................................................................................................... 71<br />
DC offset ..................................................................................................................................... 71<br />
Numerical <strong>in</strong>put ................................................................................................................................. 71<br />
Presets ................................................................................................................................................ 72<br />
Stor<strong>in</strong>g ......................................................................................................................................... 72<br />
Select<strong>in</strong>g ...................................................................................................................................... 73<br />
Clear<strong>in</strong>g ....................................................................................................................................... 73<br />
Perform<strong>in</strong>g a sweep ........................................................................................................................... 73<br />
Generat<strong>in</strong>g a previous measured signal from a file ........................................................................... 74<br />
Measur<strong>in</strong>g and stor<strong>in</strong>g a signal ................................................................................................... 74<br />
Sett<strong>in</strong>g the function generator ..................................................................................................... 74<br />
Table of Contents<br />
viii
<strong>DI</strong>-<strong>770</strong> and WINDAQ/Scope Manual<br />
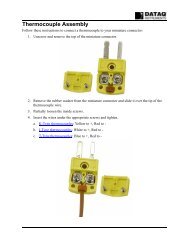
1. Introduction<br />
Many technicians <strong>in</strong>vestigate electrical signals. Though the measurement may not be electrical, the physical variable<br />
is often converted to an electrical signal, with a special transducer. Common transducers are accelerometers, pressure<br />
probes, current clamps and temperature probes. The advantages of convert<strong>in</strong>g the physical parameters to electrical<br />
signals are large, s<strong>in</strong>ce several <strong><strong>in</strong>struments</strong> for exam<strong>in</strong><strong>in</strong>g electrical signals are available.<br />
The <strong>DI</strong>-<strong>770</strong> is a two channel, 25 or 100 M samples/sec measur<strong>in</strong>g <strong>in</strong>strument. With the accompany<strong>in</strong>g software the<br />
<strong>DI</strong>-<strong>770</strong> can be used as an oscilloscope, a storage oscilloscope, a spectrum analyzer, a true RMS voltmeter, or a data<br />
logger. All <strong><strong>in</strong>struments</strong> measure by sampl<strong>in</strong>g the <strong>in</strong>put signals, digitiz<strong>in</strong>g the values, process them, save them and display<br />
them.<br />
ATTENTION!<br />
Measur<strong>in</strong>g directly on the LINE VOLTAGE can be very dangerous. The OUTSIDE of the BNC CONNECTORS at<br />
the <strong>DI</strong>-<strong>770</strong> are connected with the GROUND of the computer.<br />
Use a good isolation transformer or a differential probe when measur<strong>in</strong>g at the LINE VOLTAGE or at GROUND-ED<br />
POWER SUPPLIES!<br />
In case this has not been considered and the GROUND of the <strong>DI</strong>-<strong>770</strong> is connected to a positive voltage, a short-circuit<br />
current will be flow<strong>in</strong>g. Because of this short-circuit current both the <strong>DI</strong>-<strong>770</strong> and the computer can be damaged.<br />
Safety<br />
Before you start work<strong>in</strong>g with the <strong>DI</strong>-<strong>770</strong>, first read these safety rules.<br />
• Avoid work<strong>in</strong>g al<strong>one</strong>.<br />
• Check the probes / test leads for damages. Do NOT use them if they are damaged.<br />
• Take care when measur<strong>in</strong>g at voltages higher than 25V AC or 60 V DC.<br />
• Measur<strong>in</strong>g directly on the LINE VOLTAGE can be very dangerous. The OUTSIDE of the BNC CONNECTORS<br />
at the <strong>DI</strong>-<strong>770</strong> are connected with the GROUND of the computer.<br />
• Use a good isolation transformer or a differential probe when measur<strong>in</strong>g at the LINE VOLTAGE or at<br />
GROUNDED POWER SUPPLIES!<br />
• In case this has not been considered and the GROUND of the <strong>DI</strong>-<strong>770</strong> is connected to a positive voltage, a shortcircuit<br />
current will be flow<strong>in</strong>g. Because of this short-circuit current both the <strong>DI</strong>-<strong>770</strong> and the computer can be<br />
damaged.<br />
Introduction<br />
1
<strong>DI</strong>-<strong>770</strong> and WINDAQ/Scope Manual<br />
Sampl<strong>in</strong>g<br />
When sampl<strong>in</strong>g the <strong>in</strong>put signal, samples are taken at certa<strong>in</strong> moments. The frequency at which the samples are taken<br />
is called the sampl<strong>in</strong>g frequency. By tak<strong>in</strong>g a (large) number of samples, the <strong>in</strong>put signal can be reconstructed.<br />
The more samples are taken, the better the signal can be reconstructed. The sampl<strong>in</strong>g frequency must be higher than 2<br />
times the highest frequency <strong>in</strong> the <strong>in</strong>put signal. This is called the Nyquist frequency. Theoretically it is possible to<br />
reconstruct the <strong>in</strong>put signal with more than 2 samples. In practice, 10 to 20 samples are necessary to be able to exam<strong>in</strong>e<br />
the signal thoroughly.<br />
Alias<strong>in</strong>g<br />
If the sampl<strong>in</strong>g frequency is lower than 2 times the frequency of the <strong>in</strong>put signal, 'alias<strong>in</strong>g' will occur. The follow<strong>in</strong>g<br />
illustration shows how alias<strong>in</strong>g occurs.<br />
The <strong>in</strong>put signal is a triangular signal with a frequency of 1.25 kHz (upper most <strong>in</strong> the illustration). The signal is sampled<br />
at a frequency of 1 kHz. The dotted signal is the result of the reconstruction. From that triangular signal the periodical<br />
time is 4 ms, which corresponds with an apparent frequency (alias) of 250 Hz (1.25 kHz - 1 kHz).<br />
To avoid alias<strong>in</strong>g, the sample frequency must be higher than 2 times the maximum frequency of the <strong>in</strong>put signal.<br />
Introduction<br />
2
<strong>DI</strong>-<strong>770</strong> and WINDAQ/Scope Manual<br />
Alias<strong>in</strong>g is not always visible on an oscilloscope. In the latter illustration, it gives a 'good look<strong>in</strong>g' picture. It is not<br />
apparent that alias<strong>in</strong>g occurs. The next illustration gives an example of visible alias<strong>in</strong>g.<br />
This time it is a s<strong>in</strong>e wave signal with a frequency of 25.7 kHz, which is sampled at a frequency of 5 kHz. The m<strong>in</strong>imal<br />
sampl<strong>in</strong>g frequency should have been 51.4 kHz. For proper analysis, the sampl<strong>in</strong>g frequency should have been<br />
500 khz.<br />
Digitiz<strong>in</strong>g<br />
After tak<strong>in</strong>g a sample of the <strong>in</strong>put signal, it is digitized. This is d<strong>one</strong> with an Analog to Digital Convertor, ADC. The<br />
ADC converts the size of the signal to a digital number. This is called quantify<strong>in</strong>g.<br />
The first condition for accurate measurement is to have as many as possible quantify<strong>in</strong>g steps. This can be realized by<br />
us<strong>in</strong>g an ADC with a resolution as high as possible.<br />
The resolution of ADC's is often given <strong>in</strong> bits. The number of bits determ<strong>in</strong>es the number of quantify<strong>in</strong>g steps accord<strong>in</strong>g<br />
the formula:<br />
number of bits<br />
number of quantify<strong>in</strong>g steps = 2<br />
A 2 bits ADC has 4 quantify<strong>in</strong>g steps. With an <strong>in</strong>put range of 10 Volt, this ADC can divide the <strong>in</strong>put range <strong>in</strong> 4 parts<br />
of each 2.5 Volt.<br />
By <strong>in</strong>creas<strong>in</strong>g the number of bits, the resolution <strong>in</strong>creases, the number of quantify<strong>in</strong>g steps <strong>in</strong>creases and the sub-divisions<br />
get smaller.<br />
The probes<br />
The <strong>DI</strong>-<strong>770</strong> is shipped with two probes. These are 1x/10x selectable passive probes. This means that the <strong>in</strong>put signal<br />
is passed through directly or 10 times attenuated.<br />
The x10 attenuation is achieved by means of an attenuation network. This attenuation network has to be adjusted to<br />
the oscilloscope <strong>in</strong>put circuitry, to guarantee frequency <strong>in</strong>dependency. This is called the low frequency compensation.<br />
Each time a probe is used on an other channel or an other oscilloscope, the probe must be adjusted.<br />
Therefore the probe is equipped with a setscrew, with which the parallel capacity of the attenuation network can be<br />
altered. To adjust the probe, switch the probe to the x10 and attach the probe to a 1 kHz square wave signal. Then<br />
adjust the probe for a square front corner on the square wave displayed. See also the follow<strong>in</strong>g illustration.<br />
Introduction<br />
3
<strong>DI</strong>-<strong>770</strong> and WINDAQ/Scope Manual<br />
correct:<br />
under compensated:<br />
over compensated:<br />
Introduction<br />
4
<strong>DI</strong>-<strong>770</strong> and WINDAQ/Scope Manual<br />
2. Specifications<br />
<strong>Oscilloscope</strong><br />
Display channels:<br />
CH1, CH2, CH1 and CH2<br />
Display Mode<br />
Envelope: On/Off<br />
Averag<strong>in</strong>g: 1.. 256 averag<strong>in</strong>g<br />
Math mode: CH1+CH2, CH1-CH2, CH2-CH1<br />
Polarity:<br />
Normal, Invert<br />
Vertical position sett<strong>in</strong>g:<br />
200mVolt, 500mVolt, 1V, 2V, 5V, 10V, 20V, 40V 80 Volt full scale<br />
Vertical ga<strong>in</strong> sett<strong>in</strong>g:<br />
0.25 to 8 magnify<strong>in</strong>g<br />
Input coupl<strong>in</strong>g:<br />
AC/DC<br />
Time base m<strong>in</strong>imum:<br />
20 day's/div<br />
Time base maximum:<br />
<strong>DI</strong>-<strong>770</strong>-25: 400nsec/div<br />
<strong>DI</strong>-<strong>770</strong>-100: 100nsec/div<br />
Time base ga<strong>in</strong>:<br />
0.25 to 8 magnify<strong>in</strong>g<br />
Time base accuracy:<br />
±100 ppm from 0°C to 70°C.<br />
Ag<strong>in</strong>g = ±5ppm per year.<br />
Record length:<br />
1 to 131060 samples per channel<br />
Record view scroll bar ga<strong>in</strong>: 1 to 125<br />
Trigger mode:<br />
free run, delayed run, auto, s<strong>in</strong>gle, edge triggered, w<strong>in</strong>dow, peak, external<br />
Trigger system:<br />
two digital trigger levels, 4096 positions<br />
Trigger source:<br />
CH1, CH2, External, Keyboard and Master<br />
Trigger level:<br />
0-100% full <strong>in</strong>put range<br />
Pre trigger:<br />
1 to 131060 samples per channel<br />
Post trigger:<br />
1 to 131060 samples per channel<br />
Trigger delay:<br />
1 to 131060 samples per channel<br />
Trigger hysteresis:<br />
0 to 100% full <strong>in</strong>put range<br />
Trigger hysteresis resolution:<br />
0.025% full scale<br />
Auto disk measur<strong>in</strong>g:<br />
1 to 1000 file's<br />
Auto setup:<br />
connect and show<br />
Zoom<strong>in</strong>g:<br />
mouse w<strong>in</strong>dow control, ga<strong>in</strong> vertical and ga<strong>in</strong> horizontal<br />
Cursor system:<br />
two cursors, auto track<strong>in</strong>g, auto correct po<strong>in</strong>ts<br />
Cursor mode:<br />
large cursors, small cursors<br />
Cursor measurements:<br />
rise time left; rise time right; sample time left; sample time right; sample<br />
time difference; cursor frequency; Voltage left; Voltage right; Voltage difference;<br />
slew rate left; slew rate right; fase difference <strong>in</strong> Degrees, Radials<br />
or cos()<br />
Specifications<br />
5
<strong>DI</strong>-<strong>770</strong> and WINDAQ/Scope Manual<br />
Color sett<strong>in</strong>gs:<br />
Fonts:<br />
CH1, CH2, Ref CH1, Ref CH2, math, trigger, timebase, background, raster,<br />
cursors<br />
user selectable<br />
Voltmeter<br />
Display channels:<br />
Display size:<br />
Number of displays:<br />
Frequency range:<br />
Full scale read<strong>in</strong>g:<br />
Accuracy DC coupled:<br />
Accuracy AC coupled<br />
Measurements:<br />
Display mode:<br />
Measure units:<br />
Relative:<br />
Sound sett<strong>in</strong>gs:<br />
Data stor<strong>in</strong>g:<br />
Acquisition hysteresis:<br />
CH1, CH2, CH1 and CH2<br />
user selectable<br />
1 to 6 user selectable<br />
<strong>DI</strong>-<strong>770</strong>-25: 10 Hz to 2 MHz<br />
<strong>DI</strong>-<strong>770</strong>-100: 10 Hz to 10 MHz<br />
2000 counts<br />
0.2% ±10 counts<br />
0.3% ±10 counts (10 to 1 MHz)<br />
0.7% ±20 counts (1 MHz to 5 MHz)<br />
2.5% ±20 counts (1 MHz to 5 MHz)<br />
low frequency roll of frequency is 10 Hz<br />
True RMS, Peak-Peak, Mean, Max, M<strong>in</strong>, dBm, Power, Crest, Frequency,<br />
Duty cycle, Moment, value<br />
CH1, CH2, CH1*CH2, CH1/CH2, CH1-CH2, CH2-CH1, CH1+CH2,<br />
>the Hi,
<strong>DI</strong>-<strong>770</strong> and WINDAQ/Scope Manual<br />
Input coupl<strong>in</strong>g:<br />
Frequency axis:<br />
Octave range:<br />
Frequency range:<br />
Record length:<br />
W<strong>in</strong>dows functions:<br />
Averag<strong>in</strong>g:<br />
Cursor readout:<br />
Total Harmonic Distortion:<br />
AC/DC<br />
Logarithmic, l<strong>in</strong>ear, octaves or third octave<br />
22.1Hz to 22.6 kHz<br />
<strong>DI</strong>-<strong>770</strong>-100: 0.01 Hz to 50 MHz<br />
<strong>DI</strong>-<strong>770</strong>-25: 0.01 Hz to 12.5 MHz<br />
32768 to 32 frequency comp<strong>one</strong>nts<br />
rectangular, Hann<strong>in</strong>g, Hamm<strong>in</strong>g, Bartlett, Blackman, Parzen<br />
1 to 256 measurements<br />
see oscilloscope<br />
1 to 100 spectrums<br />
Arbitrary Waveform Generator<br />
Signal sources:<br />
s<strong>in</strong>e, triangle, square DC white noise, user def<strong>in</strong>ed<br />
Sweep:<br />
locked on spectrum analyzer<br />
Frequency:<br />
0.01 Hz to 2 MHz<br />
Amplitude:<br />
0 ± 12 Volt, max 50 mAmp<br />
Symmetry: 0 to 99%<br />
DC offset:<br />
0 ± 12 Volt<br />
Presets:<br />
10 storage<br />
Record length:<br />
256 Kwords<br />
Acquisition System<br />
Resolution:<br />
Bandwidth (-3dB):<br />
Sample rate:<br />
Sample source:<br />
Number of <strong>in</strong>put channels:<br />
Input sensitivity:<br />
Input protection:<br />
Input impedance:<br />
Input coupl<strong>in</strong>g:<br />
Input accuracy:<br />
AC coupl<strong>in</strong>g cut off frequency (-3dB):<br />
Memory:<br />
8 bit @ 100 MHz<br />
12 bit @ 50 MHz<br />
14 bit @ 3.125 MHz<br />
16 bit @ 195 kHz<br />
DC to 50 MHz maximum<br />
<strong>DI</strong>-<strong>770</strong>-25: 25 MHz, 40 nsec<br />
<strong>DI</strong>-<strong>770</strong>-100: 100 MHz, 10 nsec<br />
<strong>in</strong>ternal 0.01%, external<br />
2 analog<br />
200 mVolt .. 80 Volt full scale<br />
200 Volt (DC + AC peak < 10 kHz)<br />
1 MOhm / 30 pF<br />
AC/DC<br />
0.2% ± 1 LSB<br />
1 Hz with 1x probe<br />
0 - 131060 samples each channel<br />
Arbitrary Waveform Generator (<strong>in</strong>dependent from acquisition system)<br />
Resolution:<br />
14 bit @ 50 MHz<br />
Specifications<br />
7
<strong>DI</strong>-<strong>770</strong> and WINDAQ/Scope Manual<br />
Sample rate:<br />
Bandwidth:<br />
Impedance:<br />
Coupl<strong>in</strong>g:<br />
Output amplitude:<br />
Amplitude step:<br />
DC level:<br />
Waveforms:<br />
Symmetry:<br />
Memory:<br />
50 MHz<br />
DC to 2MHz<br />
50 Ohm<br />
DC<br />
-12 Volt .. 12 Volt<br />
0 - ±0.1 V range, 8192 steps<br />
±0.1 - ±0.9 V range, 8192 steps<br />
±0.9 - ±12 V range, 8192 steps<br />
0 - ±12 V <strong>in</strong> 8192 steps<br />
s<strong>in</strong>e, triangle, square, DC, noise and user def<strong>in</strong>ed<br />
1 - 99%, 1% steps<br />
1 - 256 Kwords<br />
Trigger System<br />
System:<br />
Source:<br />
Trigger modes:<br />
Level adjustment:<br />
Hysteresis adjustment:<br />
Resolution:<br />
Pre trigger:<br />
Post trigger:<br />
Digital trigger <strong>in</strong>put level:<br />
digital, 2 levels<br />
CH1, CH2, AND, OR, digital external<br />
ris<strong>in</strong>g slope, fall<strong>in</strong>g slope, <strong>in</strong>side w<strong>in</strong>dow, outside w<strong>in</strong>dow, peak<br />
0 - 100% of full scale<br />
0 - 100% of full scale<br />
0.025% (12 bits)<br />
0 - 131060 samples (0 - 100%, <strong>one</strong> sample resolution)<br />
0 - 131060 samples (0 - 100%, <strong>one</strong> sample resolution)<br />
0 - 3.3 volt (5 volt max)<br />
Power Requirements<br />
Power from USB port:<br />
Power via extension connector:<br />
500 mAmp max (2.5 Watt max)<br />
1500 mAmp max (7.5 Watt max)<br />
Physical<br />
Dimensions:<br />
Weight:<br />
Cord length:<br />
1.0 × 6.7 × 5.2 <strong>in</strong>. (25 × 170 × 140 mm)<br />
approx. 2 pounds 10 ounces (1190 grams)<br />
1.8 meter (70 <strong>in</strong>ch)<br />
I/O Connectors<br />
Input Channel 1:<br />
BNC<br />
Input Channel 2:<br />
BNC<br />
Output AWG:<br />
BNC<br />
USB:<br />
USB 2.0 and USB 1.1 type A<br />
Extension connector: Sub-D 25 p<strong>in</strong>s female<br />
Specifications<br />
8
<strong>DI</strong>-<strong>770</strong> and WINDAQ/Scope Manual<br />
System Requirements<br />
PC I/O connection:<br />
Operat<strong>in</strong>g system:<br />
USB 2.0 or USB 1.1 port type A<br />
W<strong>in</strong>dows 98/2000/ME/XP<br />
Operat<strong>in</strong>g Environment<br />
Ambient temperature: 0 to 55 °C<br />
Relative humidity:<br />
10 to 90% non condens<strong>in</strong>g<br />
Storage Environment<br />
Ambient temperature: -20 to 70 °C<br />
Relative humidity:<br />
5 to 95% non condens<strong>in</strong>g<br />
Certifications and Compliances<br />
CE mark compliance:<br />
CE<br />
Package<br />
Instrument:<br />
Accessories:<br />
Software:<br />
Drivers:<br />
Manual:<br />
<strong>DI</strong>-<strong>770</strong><br />
2 oscilloscope probes 1:1 - 1:10 switchable<br />
W<strong>in</strong>dows 98/2000/ME/XP on CD<br />
W<strong>in</strong>dows 98/2000/ME/XP on CD<br />
pr<strong>in</strong>ted on paper and digital on CD<br />
Specifications<br />
9
<strong>DI</strong>-<strong>770</strong> and WINDAQ/Scope Manual<br />
3. Installation<br />
The <strong>DI</strong>-<strong>770</strong> is an external measur<strong>in</strong>g <strong>in</strong>strument which can be connected to a PC.<br />
The <strong>DI</strong>-<strong>770</strong> is connected to a USB port of the PC us<strong>in</strong>g the attached cable.<br />
The <strong>DI</strong>-<strong>770</strong> does not need an external power supply, but is powered by the computer, through the USB.<br />
The USB can deliver only a limited amount of power. In case the USB can not supply enough power, an extra cable is<br />
supplied which can be connected to the <strong>DI</strong>-<strong>770</strong> and between the computer and the keyboard cable. In that case the <strong>DI</strong>-<br />
<strong>770</strong> will be powered by the keyboard connection.<br />
Note: The outside of the external power connector is connected to +5 Volt. In order to avoid shortage, first connect<br />
the cable to the <strong>DI</strong>-<strong>770</strong> and then to the keyboard connector.<br />
Requirements<br />
To use the W<strong>in</strong>dows software you need:<br />
• An IBM compatible PC/AT with 386/25 processor or higher (mathematic coprocessor recommended)<br />
• Microsoft W<strong>in</strong>dows 3.1 or higher<br />
• 32 MB RAM<br />
• 4 MB free hard disk space<br />
• A mouse or other po<strong>in</strong>t<strong>in</strong>g device<br />
• A CD-ROM drive.<br />
Optional<br />
A sound card with wave file playback and/or general midi.<br />
Driver Installation<br />
1. With your computer powered, W<strong>in</strong>dows runn<strong>in</strong>g, and all other applications closed, plug the appropriate end of<br />
the supplied USB communications cable <strong>in</strong>to the USB port (labeled USB) on the rear panel of the <strong>in</strong>strument.<br />
Connect the other end of this cable to <strong>one</strong> of your computer's USB ports. The addition of this new piece of hardware<br />
will be “sensed” by W<strong>in</strong>dows and the “Found New Hardware Wizard” will automatically be launched,<br />
anticipat<strong>in</strong>g the <strong>in</strong>stallation of a device driver for the new hardware.<br />
2. Insert The WINDAQ Resource CD-ROM <strong>in</strong>to your CD-ROM drive. It conta<strong>in</strong>s the device drivers for the <strong>DI</strong>-<strong>770</strong>.<br />
If your W<strong>in</strong>dows auto play feature is enabled, the WINDAQ Software Installation will start. Click on the Exit button<br />
to leave the <strong>in</strong>stallation.<br />
3. Click through the defaults to <strong>in</strong>stall the Driver.<br />
Note: If you receive the Microsoft-issued warn<strong>in</strong>g that the software “has not passed W<strong>in</strong>dows Logo test<strong>in</strong>g to<br />
verify its compatibility with W<strong>in</strong>dows XP” click “Cont<strong>in</strong>ue Anyway” to cont<strong>in</strong>ue with <strong>in</strong>stallation.<br />
4. After the Driver is <strong>in</strong>stalled, click F<strong>in</strong>ish to close the Found New Hardware Wizard. W<strong>in</strong>dows should prompt you<br />
that the device has been <strong>in</strong>stalled properly.<br />
Hardware Installation<br />
11
<strong>DI</strong>-<strong>770</strong> and WINDAQ/Scope Manual<br />
Install<strong>in</strong>g WINDAQ/Scope Software<br />
The WINDAQ Resource CD-ROM conta<strong>in</strong>s all the software required for use with your <strong>DI</strong>-<strong>770</strong> <strong>in</strong>strument.<br />
1. Re-<strong>in</strong>sert the WINDAQ Resource CD for the auto play feature to run or run the Setup application.<br />
2. In the “What do you want to do” w<strong>in</strong>dow, select “Install Software” and click OK.<br />
3. In the “Install<strong>in</strong>g Software” w<strong>in</strong>dow, select “Install Software for all other products” and click OK.<br />
4. From the list provided select “W<strong>in</strong>Daq/Scope for <strong>DI</strong>-<strong>770</strong>” and click OK.<br />
5. In the Welcome! box, click OK to cont<strong>in</strong>ue.<br />
6. Read the License Agreement. If you accept the terms, click “Accept and Cont<strong>in</strong>ue.” If you choose not to accept,<br />
this will end the <strong>in</strong>stallation.<br />
7. When prompted, specify the directory where you want to <strong>in</strong>stall the software. It is recommended that you accept<br />
the default (C:\W<strong>in</strong>Daq<strong>770</strong>).<br />
8. When prompted to Select a Program Manager Group specify a dest<strong>in</strong>ation (or group w<strong>in</strong>dow) <strong>in</strong> the Start Menu<br />
for your software icons. It is recommended that you accept the default.<br />
9. Installation is complete - you will now see a Successful Installation box - click on OK to exit WINDAQ Installation.<br />
10. To run WINDAQ/Scope software go to the appropriate program group (specified above—default is Start > Programs<br />
> WINDAQ Scope) and click on W<strong>in</strong>Daq Scope.<br />
Hardware Installation<br />
12
<strong>DI</strong>-<strong>770</strong> and WINDAQ/Scope Manual<br />
4. Connections<br />
Extension connector<br />
To connect to the <strong>DI</strong>-<strong>770</strong>, a 25 p<strong>in</strong> female Sub-D connector is available, conta<strong>in</strong><strong>in</strong>g the follow<strong>in</strong>g signals:<br />
1 Ground 14 Ground<br />
2 not connected 15 Ground<br />
3 External power <strong>in</strong> 5V DC/ 500 mA 16 Ground<br />
4 Ground 17 Ground<br />
5 5 V out, 10 mA max. 18 Ground<br />
6 External, sampl<strong>in</strong>g clock <strong>in</strong> 19 Ground<br />
7 Ground 20 not connected<br />
8 External trigger <strong>in</strong> (TTL) 21 not connected<br />
9 Data OK out (TTL) 22 Ground<br />
10 Ground 23 I 2 C SDA<br />
11 Trigger out (TTL) 24 I 2 C SCL<br />
12 Square wave generator out (TTL) 25 Ground<br />
13 External sampl<strong>in</strong>g clock out<br />
External power<br />
The <strong>DI</strong>-<strong>770</strong> is powered through the USB. If the USB cannot deliver enough power, an external power cable, to the<br />
keyboard connector, can be connected.<br />
Note: The outside of the external power connector is connected to +5 Volt. In order to avoid shortage, first connect<br />
the cable to the <strong>DI</strong>-<strong>770</strong> and then to the keyboard connector.<br />
Center P<strong>in</strong> Ø 1.3 mm Ground<br />
Outside bush<strong>in</strong>g Ø 3.5 mm + 5 V DC<br />
Connections<br />
13
<strong>DI</strong>-<strong>770</strong> and WINDAQ/Scope Manual<br />
5. WINDAQ/Scope Software<br />
This manual expects that the reader has a basic knowledge how to control applications runn<strong>in</strong>g under w<strong>in</strong>dows, work<strong>in</strong>g<br />
with menus <strong>in</strong> w<strong>in</strong>dows applications, etc.<br />
1. Set the trigger level, the trigger hysteresis and the trigger slope by dragg<strong>in</strong>g and double click<strong>in</strong>g. Press the right<br />
mouse button and setup the complete trigger system.<br />
2. Toggle auto rang<strong>in</strong>g for channel 1. Press the right mouse button and select an <strong>in</strong>put sensitivity from a menu.<br />
3. Toggle the <strong>in</strong>vert for channel 1.<br />
4. Set the signal coupl<strong>in</strong>g for channel 1 to AC or DC.<br />
5. Copy, show, save and load reference signals.<br />
6. Select a math channel.<br />
7. Toggle envelope mode.<br />
Software<br />
15
<strong>DI</strong>-<strong>770</strong> and WINDAQ/Scope Manual<br />
8. With the auto setup the oscilloscope sets itself accord<strong>in</strong>g the <strong>in</strong>put signal.<br />
9. Switch between a number of pre def<strong>in</strong>ed offset and ga<strong>in</strong> sett<strong>in</strong>gs for channel 2. Press the right mouse button and<br />
select the sett<strong>in</strong>gs from a menu.<br />
10. Adjust the pre trigger po<strong>in</strong>t. Press the right mouse button and setup the complete time axis.<br />
1. The bar graph of display 2 of channel 1, for a quick <strong>in</strong>dication of the signal size.<br />
2. Display 1 of channel 1, press the right mouse button to setup the display.<br />
3. Reset the m<strong>in</strong>imum and maximum values.<br />
4. Stop the measurements with this button.<br />
5. Perform a s<strong>in</strong>gle measurement with this button.<br />
6. Perform a measurement at settable times and send the result to the pr<strong>in</strong>ter.<br />
7. Perform a measurement at settable times and store the result on disk.<br />
8. Switch the channel 2 signal coupl<strong>in</strong>g to AC or DC.<br />
Software<br />
16
<strong>DI</strong>-<strong>770</strong> and WINDAQ/Scope Manual<br />
1. Drag this end of the axis and adjust the ga<strong>in</strong> of channel 1. Press the right mouse button and setup channel 1.<br />
2. With the Stop button the data logger is stopped.<br />
3. Start a measurement with the data logger<br />
4. Zoom <strong>in</strong> to a specific part of the signal<br />
5. Erase the signal screen.<br />
6. The time axis can display sample times and real time and date. Set this by open<strong>in</strong>g the Sett<strong>in</strong>gs menu. The right<br />
mouse buttons allows the complete time base to be set up.<br />
7. Drag this end of the slider and change the horizontal magnification. Press the right mouse button and setup the<br />
time base.<br />
8. Drag the slider and adjust the horizontal position of the signal. Press the right mouse button and setup the time<br />
base.<br />
9. The h<strong>in</strong>t bar displays explanation of the objects the mouse is placed on.<br />
10. Drag the vertical axis and adjust the vertical position of the signal. Press the right mouse button and setup channel<br />
1.<br />
Software<br />
17
<strong>DI</strong>-<strong>770</strong> and WINDAQ/Scope Manual<br />
1. Press this button to place a comment label <strong>in</strong> the display.<br />
2. Press the W<strong>in</strong>dow button to select a w<strong>in</strong>dow function for the FFT.<br />
3. Stop the cont<strong>in</strong>uous measurements.<br />
4. Make a hard copy of the current signal.<br />
5. Measure the Total Harmonic Distortion.<br />
6. Double click here to switch channel 2 on.<br />
7. Press the right mouse button to setup the frequency axis.<br />
8. Dragg<strong>in</strong>g this slider adjusts the horizontal position of the signal. Press<strong>in</strong>g the right mouse button allows setup of<br />
the frequency axis.<br />
9. Drag this end of the slider (or the other end) to adjust the horizontal magnification. Press the right mouse button<br />
to setup the frequency axis.<br />
10. Drag this label of the axis and adjust the vertical magnification. Press the right mouse button to setup channel 1.<br />
11. Drag the axis and adjust the vertical position of channel 1. Press the right mouse button to setup channel 1.<br />
12. This led <strong>in</strong>dicates whether the <strong>in</strong>put signal is clipped (creates higher harmonics) or not.<br />
Software<br />
18
<strong>DI</strong>-<strong>770</strong> and WINDAQ/Scope Manual<br />
Structure of the program<br />
The program is divided <strong>in</strong>to 4 <strong>in</strong>tegrated measurement <strong><strong>in</strong>struments</strong>, which are available on the <strong>in</strong>strument taskbar:<br />
• An oscilloscope<br />
• A true RMS voltmeter<br />
• A data logger<br />
• A spectrum analyzer<br />
If an <strong>in</strong>strument is not active (<strong>in</strong>strument button state is up), the <strong>in</strong>strument can be made active by press<strong>in</strong>g the left<br />
mouse button over the <strong>in</strong>strument button. If the <strong>in</strong>strument is active (<strong>in</strong>strument button state is down) and you press<br />
the left mouse button over the <strong>in</strong>strument button, the <strong>in</strong>strument will be made <strong>in</strong>active and it will hide itself.<br />
If you have 2 or more <strong><strong>in</strong>struments</strong> active, <strong>one</strong> <strong>in</strong>strument can be on top of the other. To make the <strong>in</strong>active <strong>in</strong>strument<br />
active you can move the currently active w<strong>in</strong>dow away from the <strong>in</strong>active w<strong>in</strong>dow, so you can select it. However there<br />
is a faster way (assum<strong>in</strong>g the taskbar is visible): press the right mouse button over the <strong>in</strong>strument button.<br />
The other four buttons represent the follow<strong>in</strong>g:<br />
• The signal generator which is part of the hardware <strong>in</strong>strument. Not all <strong><strong>in</strong>struments</strong> do have a signal generator. In<br />
that case the button is not visible.<br />
• The program setup<br />
• The onl<strong>in</strong>e help<br />
• The exit button<br />
Start<strong>in</strong>g the program<br />
The program can easily be started by us<strong>in</strong>g the program group created by the setup program. By double click<strong>in</strong>g the<br />
icon with the same name as the hardware <strong>in</strong>strument you are us<strong>in</strong>g, the program is started.<br />
Now an <strong>in</strong>tro screen will appear with the logo, the <strong>in</strong>strument name, the program version number and the copyright<br />
notice.<br />
After a few seconds the <strong>in</strong>tro screen disappears and the <strong>in</strong>strument taskbar appears. If <strong>in</strong> the program setup any <strong><strong>in</strong>struments</strong><br />
are set to be active at power up, these <strong><strong>in</strong>struments</strong> are switched on as well.<br />
Help<br />
For all <strong><strong>in</strong>struments</strong> onl<strong>in</strong>e help is available by press<strong>in</strong>g the Help button <strong>in</strong> the <strong>in</strong>strument taskbar or by press<strong>in</strong>g the<br />
key <strong>in</strong> a w<strong>in</strong>dow.<br />
Controll<strong>in</strong>g the <strong><strong>in</strong>struments</strong><br />
All <strong><strong>in</strong>struments</strong> are controlled by use of the mouse, the keyboard and by menus.<br />
Software<br />
19
<strong>DI</strong>-<strong>770</strong> and WINDAQ/Scope Manual<br />
Keys that can be used<br />
<br />
Force a trigger (oscilloscope)<br />
Toggle reference 1<br />
Toggle reference 2<br />
Move the left side of the record view scrollbar to the left<br />
Move the left side of the record view scrollbar to the right<br />
Move the right side of the record view scrollbar to the left<br />
Move the right side of the record view scrollbar to the right<br />
< > Move the record view scrollbar to the left<br />
< > Move the record view scrollbar to the right<br />
<br />
<br />
<br />
<br />
<br />
<br />
<br />
<br />
<br />
<br />
<br />
<br />
Set the signal coupl<strong>in</strong>g of channel 1 to AC<br />
Set the signal coupl<strong>in</strong>g of channel 2 to AC<br />
Set the signal coupl<strong>in</strong>g of channel 1 to DC<br />
Set the signal coupl<strong>in</strong>g of channel 2 to DC<br />
Toggle Envelope mode<br />
Toggle <strong>in</strong>vert of channel 1 (oscilloscope and data logger)<br />
Toggle <strong>in</strong>vert of channel 1 (oscilloscope and data logger)<br />
Switch the vertical axis of channel 1 between L<strong>in</strong>ear and Log (spectrum analyzer)<br />
Switch the vertical axis of channel 2 between L<strong>in</strong>ear and Log (spectrum analyzer)<br />
Toggle Measur<strong>in</strong>g of Maximum values (spectrum analyzer)<br />
Perform a s<strong>in</strong>gle measurement (One shot)<br />
Make a pr<strong>in</strong>tout of the current display<br />
Toggle reference 1<br />
Toggle reference 2<br />
<br />
<br />
<br />
<br />
<br />
<br />
<br />
<br />
Start or Stop measur<strong>in</strong>g<br />
View the Total measured record<br />
Switch to X-Y mode (oscilloscope)<br />
Switch to Y-t mode (oscilloscope)<br />
Call the onl<strong>in</strong>e Help<br />
Switch the time base <strong>one</strong> step slower (oscilloscope and spectrum analyzer)<br />
Switch the time base <strong>one</strong> step faster (oscilloscope and spectrum analyzer)<br />
Switch channel 1 <strong>one</strong> step more sensitive<br />
Software<br />
20
<strong>DI</strong>-<strong>770</strong> and WINDAQ/Scope Manual<br />
<br />
<br />
<br />
<br />
<br />
Switch channel 1 <strong>one</strong> step less sensitive<br />
Switch channel 2 <strong>one</strong> step more sensitive<br />
Switch channel 2 <strong>one</strong> step less sensitive<br />
Make the record length <strong>one</strong> step shorter<br />
Make the record length <strong>one</strong> step longer<br />
Controll<strong>in</strong>g with the mouse<br />
All objects <strong>in</strong> the <strong>in</strong>strument w<strong>in</strong>dows give access to the correspond<strong>in</strong>g sett<strong>in</strong>gs by click<strong>in</strong>g the right mouse button on<br />
the objects. A popup menu will appear <strong>in</strong> which related sett<strong>in</strong>gs can be altered.<br />
When the mouse is placed on an object <strong>in</strong> an <strong>in</strong>strument w<strong>in</strong>dow, <strong>in</strong>formation about the object is given with "fly over<br />
h<strong>in</strong>ts" (small rectangles with a few words of text) and some text <strong>in</strong> the h<strong>in</strong>t bar, at the bottom of the <strong>in</strong>strument w<strong>in</strong>dow.<br />
Program setup<br />
Several parts of the program can be set up to your own demands. To change those sett<strong>in</strong>gs, press the Setup button <strong>in</strong><br />
the <strong>in</strong>strument taskbar. The follow<strong>in</strong>g dialog will appear:<br />
The dialog conta<strong>in</strong>s 5 pages with related sett<strong>in</strong>gs, the pages can be selected by click<strong>in</strong>g the tabs. Sett<strong>in</strong>gs that are<br />
made <strong>in</strong> these pages are saved when the application is closed and restored when the application is started aga<strong>in</strong>. The<br />
positions and sizes of the <strong>in</strong>strument w<strong>in</strong>dows are also saved and restored.<br />
Instrument taskbar always on top<br />
It is possible to let the <strong>in</strong>strument taskbar appear always on top of the other w<strong>in</strong>dows. In that case the <strong>in</strong>strument taskbar<br />
will always be visible. The selection for that is made on the Common page, with the Instrument taskbar always on<br />
top check box.<br />
Software<br />
21
<strong>DI</strong>-<strong>770</strong> and WINDAQ/Scope Manual<br />
Sett<strong>in</strong>g display colors<br />
The colors of channel 1, channel 2, reference signal 1, reference signal 2, math signal, trigger symbol, timebase,<br />
background, grid and cursors can be set to your own preferences. Press the Display colors button on the Common<br />
page and a dialog will appear <strong>in</strong> which the sett<strong>in</strong>gs can be made.<br />
Sett<strong>in</strong>g the application language<br />
By select<strong>in</strong>g the language selection pull down on the Common page, you can select an other language to be used <strong>in</strong><br />
the application. The program will <strong>in</strong>stantly switch to the selected language. Also a help file <strong>in</strong> the selected language<br />
will be opened when the Help function is activated.<br />
Sett<strong>in</strong>g the location of files<br />
By press<strong>in</strong>g the Directories button on the Common page, it is possible to set the directories for the files the program<br />
works with. A popup menu will appear. From this menu you can select a directory which you wish to change. After<br />
select<strong>in</strong>g a directory, an <strong>in</strong>put dialog appears <strong>in</strong> which you can enter the name for directory.<br />
Default text on the pr<strong>in</strong>ter output<br />
It is possible to add three l<strong>in</strong>es of text to the application. These l<strong>in</strong>es of text will be placed on every pr<strong>in</strong>tout. They are<br />
placed on the upper left corner of the pr<strong>in</strong>tout. Enter here e.g. the company address, employee name, teleph<strong>one</strong> number<br />
etc.<br />
To enter the text, click the button Default text on the Common page and an <strong>in</strong>put dialog will appear.<br />
The three l<strong>in</strong>es of text can be entered here. To switch between the three l<strong>in</strong>es, use the key or click with the<br />
mouse <strong>in</strong> the requested l<strong>in</strong>e.<br />
This text is saved when the application is closed and loaded when the application is started.<br />
Device <strong>in</strong>fo<br />
In the lower part of the Common page some device <strong>in</strong>fo is given. Information that is displayed is:<br />
• The hardware device<br />
• The address where the hardware is found<br />
• The resolution of the hardware<br />
Depend<strong>in</strong>g on the hardware device some extra <strong>in</strong>fo can be displayed:<br />
• The date of the last calibration<br />
• The serial number<br />
Sett<strong>in</strong>g the date and time style<br />
At several places <strong>in</strong> the program dates and/or times are displayed. The way they are displayed can be set at the date<br />
and time page. For both the date and the time several styles are available to select from.<br />
Search hardware<br />
When the software is started without an <strong>in</strong>strument, a dialog appears to notify the user that the <strong>in</strong>strument is not<br />
found. It is possible to press Ignore to be able to exam<strong>in</strong>e previous saved waveforms. When the <strong>in</strong>strument is then<br />
attached to the computer, it can be searched and activated by press<strong>in</strong>g the Search hardware button on the Hardware<br />
page.<br />
Manually adjust<strong>in</strong>g of calibration factors<br />
By select<strong>in</strong>g the Adjust cal. values button at the Hardware page, a dialog appears <strong>in</strong> which the current calibration values<br />
of the <strong>in</strong>strument can be changed.<br />
Software<br />
22
<strong>DI</strong>-<strong>770</strong> and WINDAQ/Scope Manual<br />
The dialog has a grid <strong>in</strong> which for both channels the ga<strong>in</strong> and offset calibration values can be adjusted. On the right<br />
are the follow<strong>in</strong>g buttons:<br />
Cont<strong>in</strong>ue<br />
Cancel<br />
Load values<br />
Save values<br />
Apply<br />
The currently displayed values are set as the calibration values to use. Load<strong>in</strong>g of a calibration<br />
file at start-up will be disabled.<br />
All changes (<strong>in</strong>clud<strong>in</strong>g the applied) are ignored and the calibration values which were used prior<br />
to press<strong>in</strong>g the adjust cal. values button are restored.<br />
A file dialog is presented <strong>in</strong> which a file can be selected with calibration values, which has to be<br />
loaded and displayed <strong>in</strong> the grid.<br />
A file dialog is presented <strong>in</strong> which a filename can be typed or selected to which the values currently<br />
displayed <strong>in</strong> the grid can be saved.<br />
Sets the current grid values as the calibration values to use. A <strong>one</strong> shot is d<strong>one</strong> so the result is<br />
displayed. The apply is not permanent until the Cont<strong>in</strong>ue button is pressed.<br />
Restore factory calibration factors<br />
The <strong>DI</strong>-<strong>770</strong> has a set of calibration factors <strong>in</strong> EEPROM which are read at power up of the software. If the calibration<br />
factors are altered manually, the orig<strong>in</strong>al values can be restored by press<strong>in</strong>g the Restore factory cal. button.<br />
If load<strong>in</strong>g a calibration file at startup is enabled, this will be disabled by press<strong>in</strong>g the Restore factory cal. button.<br />
Load<strong>in</strong>g a set of calibration values at start up<br />
When a specific set of calibration values is made, it can be stored on disk. To use this file of calibration values at<br />
power up, place a check mark <strong>in</strong> the Use cal. file check box at the Hardware page. If no file name was selected yet, a<br />
file open dialog will appear <strong>in</strong> which a file with calibration values can be selected. If an illegal file is selected or cancel<br />
is pressed the check box will be untagged.<br />
Press<strong>in</strong>g the Restore factory cal. button will override the values from the file.<br />
When load<strong>in</strong>g calibration values from a file is enabled and a different file has to be loaded, this file can be selected by<br />
press<strong>in</strong>g the Change cal. file button at the Hardware page. If cancel is pressed or an illegal file is selected, no changes<br />
are made to the current selected calibration file.<br />
Select<strong>in</strong>g the type of duty cycle<br />
The software can use two different types of duty cycle calculation:<br />
• The normal duty cycle sett<strong>in</strong>g displays the percentage of which the period is high.<br />
• The <strong>in</strong>verted duty cycle sett<strong>in</strong>g displays the percentage of which the period is low.<br />
Selection can be made on the Duty cycle page, by select<strong>in</strong>g <strong>one</strong> of the two radio buttons. The pictures next to the<br />
radio buttons display the two types <strong>in</strong> a graphical way.<br />
Active <strong><strong>in</strong>struments</strong> at start up<br />
At the Active <strong><strong>in</strong>struments</strong> page a selection can be made which <strong><strong>in</strong>struments</strong> have to be switched on at start up of the<br />
software.<br />
Place a check <strong>in</strong> the check boxes of the <strong><strong>in</strong>struments</strong> that have to be switched on at start up of the software.<br />
Note: The data logger can not be activated at the same time as <strong>one</strong> of the other <strong><strong>in</strong>struments</strong>.<br />
When at least <strong>one</strong> <strong>in</strong>strument is selected, it is possible to select a sett<strong>in</strong>gs file that has to be loaded at start up as well.<br />
Each s<strong>in</strong>gle <strong>in</strong>strument can have its own sett<strong>in</strong>gs file.<br />
Selection of the file is d<strong>one</strong> by press<strong>in</strong>g the Change file name button on the Active <strong><strong>in</strong>struments</strong> page. In the appear<strong>in</strong>g<br />
dialog the file can be selected. The name of the selected file will be displayed <strong>in</strong> the Instrument sett<strong>in</strong>gs file box.<br />
Software<br />
23
<strong>DI</strong>-<strong>770</strong> and WINDAQ/Scope Manual<br />
To clear the file name, press the Clear button.<br />
Note: When more than <strong>one</strong> <strong>in</strong>strument is selected to be switched on at start up, the sett<strong>in</strong>gs file associated with the<br />
<strong>in</strong>strument with the highest 'priority' will be loaded. The priorities <strong>in</strong> file load<strong>in</strong>g are: highest: the data logger, then<br />
the oscilloscope, then the voltmeter and lowest the spectrum analyzer.<br />
Sav<strong>in</strong>g <strong>in</strong>strument sett<strong>in</strong>gs on disk<br />
When a certa<strong>in</strong> k<strong>in</strong>d of measurement is d<strong>one</strong> often, it is useful to save the <strong>in</strong>strument sett<strong>in</strong>g on disk and restore it<br />
each time it is needed. This will avoid each time sett<strong>in</strong>g up the <strong>in</strong>strument <strong>in</strong> the same way.<br />
To save the <strong>in</strong>strument sett<strong>in</strong>g to disk, enter the File menu from the oscilloscope, the data logger or the spectrum analyzer<br />
and select Save <strong>in</strong>strument sett<strong>in</strong>g.... A save dialog will appear <strong>in</strong> which a drive and directory can be selected<br />
and a name for the sett<strong>in</strong>g can be entered.<br />
If an <strong>in</strong>valid file name or a name of an exist<strong>in</strong>g file name is entered, a warn<strong>in</strong>g will be displayed.<br />
The sett<strong>in</strong>gs for all <strong><strong>in</strong>struments</strong> are saved <strong>in</strong> <strong>one</strong> file. This file has the extension .SET. It is an ASCII file, <strong>in</strong> a W<strong>in</strong>dows<br />
INI format.<br />
Note: This file can be edited <strong>in</strong> any ASCII editor, but it is recommended not to do so, to avoid <strong>in</strong>valid (comb<strong>in</strong>ations<br />
of) sett<strong>in</strong>gs.<br />
Restore <strong>in</strong>strument sett<strong>in</strong>gs from disk<br />
When a certa<strong>in</strong> k<strong>in</strong>d of measurement is d<strong>one</strong> often, it is useful to save the <strong>in</strong>strument sett<strong>in</strong>g on disk and restore it<br />
each time it is needed. This will avoid each time sett<strong>in</strong>g up the <strong>in</strong>strument <strong>in</strong> the same way.<br />
To restore <strong>in</strong>strument sett<strong>in</strong>gs from disk, enter the File menu <strong>in</strong> the oscilloscope, data logger or spectrum analyzer and<br />
select the Restore <strong>in</strong>strument sett<strong>in</strong>gs... item. A restore dialog will appear <strong>in</strong> which a drive, a directory and a file name<br />
can be selected.<br />
After press<strong>in</strong>g the OK button the file is loaded and all <strong><strong>in</strong>struments</strong> are set accord<strong>in</strong>g the sett<strong>in</strong>gs <strong>in</strong> the file.<br />
Stor<strong>in</strong>g measurement data on disk<br />
To save measured data for later exam<strong>in</strong>ation, it can be stored on disk. This can be d<strong>one</strong> <strong>in</strong> two ways: by activat<strong>in</strong>g the<br />
Write waveform to disk... item from the File menu <strong>in</strong> the oscilloscope, data logger or spectrum analyzer or by click<strong>in</strong>g<br />
the Write waveform button ( ).<br />
Note: The voltmeter has a completely different way of stor<strong>in</strong>g measurement data to disk. This will be discussed <strong>in</strong> the<br />
chapter voltmeter.<br />
Both ways will br<strong>in</strong>g a save dialog <strong>in</strong> which the drive, the directory and the filename can be entered. When a name is<br />
entered and the OK button is pressed, all waveforms will be saved, together with the sett<strong>in</strong>gs of the <strong>in</strong>strument and<br />
the references. Three files are written:<br />
a file with the extension .DAT, conta<strong>in</strong><strong>in</strong>g the waveform data of both channels and both references<br />
a file with the extension .GEG, conta<strong>in</strong><strong>in</strong>g the <strong>in</strong>strument sett<strong>in</strong>gs<br />
a file with the extension .REF, conta<strong>in</strong><strong>in</strong>g the reference channels sett<strong>in</strong>gs<br />
The files conta<strong>in</strong><strong>in</strong>g the sett<strong>in</strong>gs are ASCII files, with a w<strong>in</strong>dows INI file structure. The .DAT file can be either b<strong>in</strong>ary<br />
or <strong>in</strong> ASCII.<br />
When the file already exists, a warn<strong>in</strong>g will be given. When the disk is full, the file will not be written and an error<br />
will be put on the screen.<br />
Sett<strong>in</strong>g the data file type<br />
The waveform data can be stored <strong>in</strong> a b<strong>in</strong>ary and <strong>in</strong> an ASCII format.<br />
Software<br />
24
<strong>DI</strong>-<strong>770</strong> and WINDAQ/Scope Manual<br />
The b<strong>in</strong>ary format is built of records of 8 bytes large. The first two bytes are for channel 1, bytes 3 and 4 are for channel<br />
2, bytes 5 and 6 are for reference 1 and bytes 7 and 8 are for reference 2. The two bytes for each channel form a 16<br />
bits value, where 0 represents -sensitivity and 65535 represents +sensitivity.<br />
The ASCII format exists of <strong>one</strong> l<strong>in</strong>e of <strong>in</strong>formation for each sample <strong>in</strong> the record. Each l<strong>in</strong>e exists of:<br />
the sample number, related to the trigger po<strong>in</strong>t (sample number 0)<br />
the sample time, related to the trigger po<strong>in</strong>t (t=0)<br />
the voltage value for channel 1<br />
the voltage value for channel 2<br />
the voltage value for reference 1<br />
the voltage value for reference 2<br />
The items are separated by commas.<br />
The ASCII files can simply be imported <strong>in</strong> other applications, like e.g. spread sheet programs.<br />
Files <strong>in</strong> ASCII format are much larger than files <strong>in</strong> b<strong>in</strong>ary format, up to 7 times.<br />
To set the file type, enter the File menu and select the item Data file type. Choose the requested sett<strong>in</strong>g from the<br />
menu.<br />
Load<strong>in</strong>g saved measurement data from disk<br />
Previously saved waveforms can be read from disk <strong>in</strong> the oscilloscope, data logger and the spectrum analyzer. There<br />
are two ways to do this: by activat<strong>in</strong>g the Read waveform from disk item from the File menu or by click<strong>in</strong>g the Read<br />
waveform button ( ).<br />
Both ways will br<strong>in</strong>g up a load dialog <strong>in</strong> which a drive, directory and file can be selected. When a file is selected and<br />
the OK button is pressed, the waveform will be read from disk.<br />
Each waveform consists of three files: a .DAT file, a .GEG file and a .REF file. If <strong>one</strong> of these files is miss<strong>in</strong>g or the<br />
waveform data is not compatible, an error is generated.<br />
The data file type <strong>in</strong> which the data is written will be determ<strong>in</strong>ed by the software and the correct read<strong>in</strong>g functions are<br />
used.<br />
Then the data is read accord<strong>in</strong>g to the Waveform read method that is set.<br />
After read<strong>in</strong>g the data, the <strong>in</strong>strument is set to Pause (not required <strong>in</strong> the data logger) to avoid the data be<strong>in</strong>g replaced<br />
by new measured data.<br />
Note: Measurement data stored <strong>in</strong> the voltmeter can be read <strong>in</strong> the oscilloscope and the data logger.<br />
The values of display 1 of channel 1 will be placed <strong>in</strong> channel 1 of the data logger.<br />
The values of display 2 of channel 1 will be placed <strong>in</strong> Reference 1 of the data logger.<br />
The values of display 1 of channel 2 will be placed <strong>in</strong> channel 2 of the data logger.<br />
The values of display 2 of channel 2 will be placed <strong>in</strong> Reference 2 of the data logger.<br />
Sett<strong>in</strong>g the Waveform read method<br />
When a waveform is written to disk, all four channels (Ch1, Ch2, Reference 1 and Reference 2) are written to disk.<br />
There are two methods to read waveforms from disk:<br />
Read all signals <strong>in</strong> file<br />
With this method all signals that were active when the waveform was written are read. If e.g. Ch1 and Reference 2<br />
were active when the waveforms were saved, Ch1 and Reference 2 are read. the data <strong>in</strong> Ch2 and Reference 1 will<br />
rema<strong>in</strong> unchanged. Ch1 and Reference 2 will be switched on and Ch2 and Reference 1 will be switched off.<br />
Only read current displayed signals<br />
Software<br />
25
<strong>DI</strong>-<strong>770</strong> and WINDAQ/Scope Manual<br />
With this method only the currently active channels are read from the waveform file. The other channels will rema<strong>in</strong><br />
unchanged and they will rema<strong>in</strong> switched off.<br />
To select the proper waveform read method, enter the File menu, select the Waveform read method item and select<br />
the correct method. When clos<strong>in</strong>g the application, the selected method is saved <strong>in</strong> the application sett<strong>in</strong>gs file. This<br />
file is always read when start<strong>in</strong>g the application.<br />
Compar<strong>in</strong>g signals us<strong>in</strong>g the reference channels<br />
To be able to compare live signals to other signals, the oscilloscope, the data logger and the spectrum analyzer have<br />
two reference channels, R1 and R2. R1 is a reference channel for channel 1 and R2 is a reference channel for channel<br />
2. These reference channels are filled once and rema<strong>in</strong> unchanged while measur<strong>in</strong>g. The references only change when<br />
new data is stored <strong>in</strong> the references.<br />
Fill the references<br />
To fill the reference channel(s), two ways are available: copy<strong>in</strong>g the current displayed signals to the reference channels<br />
or read previously saved waveform data from disk.<br />
To copy the current live signals to the reference channels, either press the correspond<strong>in</strong>g button on the speed button<br />
tool bar ( ) or select the item Copy live to refs from the References menu. This will copy the waveform data from<br />
the active channel(s) to the correspond<strong>in</strong>g reference channel(s). The sett<strong>in</strong>gs of the channel(s) will also be copied to a<br />
special reference sett<strong>in</strong>g. If the reference channel(s) was (were) not yet displayed, it is (they are) switched on as well.<br />
To fill a reference channel with data from disk, see the paragraph on Load<strong>in</strong>g saved measurement data from disk.<br />
The data <strong>in</strong> the reference channels will rema<strong>in</strong> unchanged until new data is stored <strong>in</strong> the reference channels. The reference<br />
channels are displayed with the same record view offset and record view ga<strong>in</strong> as the live channels. Chang<strong>in</strong>g<br />
the pre trigger value will not affect the reference channels. When the record length of the live channels is changed to<br />
a shorter record after fill<strong>in</strong>g the reference channels, less data of the reference channels is displayed, but the data is<br />
kept <strong>in</strong> memory. When the record length is changed to a longer record, the part of the reference channel that was not<br />
filled, is filled with zeroes.<br />
Switch<strong>in</strong>g references on or off<br />
Switch<strong>in</strong>g a reference channel on or off can be d<strong>one</strong> by select<strong>in</strong>g the item Display Refx from the Reference menu,<br />
where x stands for 1 or 2. It can also be d<strong>one</strong> by means of a button on the speed button tool bar: for reference 1<br />
and for reference 2. When a button appears to be pressed, the correspond<strong>in</strong>g reference is switched on.<br />
Scal<strong>in</strong>g references<br />
When a reference channel is filled, the data rema<strong>in</strong>s the same until new data is stored <strong>in</strong> the reference channel. When<br />
the <strong>in</strong>put sensitivity, the software offset or the software ga<strong>in</strong> for the correspond<strong>in</strong>g channel changes, the reference<br />
channel will not change.<br />
It can be useful that when a signal is copied to a reference channel to compare live measurements with that reference<br />
channel, that the sett<strong>in</strong>gs of the reference channel will follow the sett<strong>in</strong>gs of the live channel. So when e.g. the <strong>in</strong>put<br />
sensitivity of the live channel changes, the reference channel is scaled <strong>in</strong> such a way that the live channel and the reference<br />
channel can still be compared on a 1:1 base.<br />
To do that, select the item Scale references from the Reference menu. Any change of the <strong>in</strong>put sensitivity, the software<br />
offset or the software ga<strong>in</strong> of a channel will also be applied to the reference channel. When scal<strong>in</strong>g references is<br />
switched on, a check mark is placed <strong>in</strong> the menu item.<br />
To switch Scal<strong>in</strong>g references off, select the Scale references item aga<strong>in</strong>.<br />
Software<br />
26
<strong>DI</strong>-<strong>770</strong> and WINDAQ/Scope Manual<br />
Update reference comment<br />
When a measurement is taken, three l<strong>in</strong>es of comment text can be added to the measurement. This text is saved to<br />
disk together with the waveform data and pr<strong>in</strong>ted out with the waveform. (See Add comment text to a measurement)<br />
When the reference channels are filled with data from a file and the comment text has to be changed, this can be d<strong>one</strong><br />
us<strong>in</strong>g the item Update comments ... from the Reference menu. After activat<strong>in</strong>g the item, a dialog appears <strong>in</strong> which the<br />
three l<strong>in</strong>es of text can be entered / changed. When the dialog is closed with the OK button, the new text is automatically<br />
saved to disk.<br />
Documentation of measurements<br />
In the oscilloscope, the data logger and the spectrum analyzer several features are available to document measurement<br />
data.<br />
Add comment text to a measurement<br />
For explanation and documentation, each measurement can be supplied with three l<strong>in</strong>es of text.<br />
This text will be saved together with the waveform data when the waveform is written to disk. The text will also<br />
appear on a hardcopy pr<strong>in</strong>tout.<br />
To enter the text, open the Sett<strong>in</strong>gs menu and select the item Comment... A dialog appears <strong>in</strong> which the three l<strong>in</strong>es of<br />
text can be typed. To switch between the three l<strong>in</strong>es, use the mouse or the key.<br />
Note: The text rema<strong>in</strong>s the same until new text is entered or the l<strong>in</strong>es are cleared. So when text is entered and more<br />
than <strong>one</strong> waveforms is saved or pr<strong>in</strong>ted, each waveform will have the same comment.<br />
Place a comment label<br />
When document<strong>in</strong>g a measurement, it can be useful to add some comment to a specific part of the signal. This can be<br />
d<strong>one</strong> with the special comment labels.<br />
These comment labels are placed with<strong>in</strong> the signal display at a specific position <strong>in</strong> relation to the waveform. The<br />
comment labels conta<strong>in</strong> text and can have an arrow po<strong>in</strong>t<strong>in</strong>g at a specific po<strong>in</strong>t of the waveform. The shape, the colors<br />
and the arrow can all be customized to your specific wishes. When pr<strong>in</strong>t<strong>in</strong>g the measurement, the comment labels are<br />
placed as well. To place a comment label, press the comment label button (<br />
) or activate the Add a comment label<br />
item from the Sett<strong>in</strong>gs menu.<br />
The comment label is now placed with<strong>in</strong> the signal display. It can be dragged to any position with the mouse and the<br />
arrow can be dragged to any position as well. The comment labels are waveform based, when the record view offset<br />
or the record view ga<strong>in</strong> changes, the position of the comment label rema<strong>in</strong>s the same <strong>in</strong> relation to the record.<br />
Edit a comment label<br />
To change the properties of a comment label, place the mouse po<strong>in</strong>ter on the comment label or the arrow of the comment<br />
label and press the right mouse button. A menu will pop up <strong>in</strong> which all properties can be edited.<br />
Comment text...<br />
With this item the text <strong>in</strong> the comment label can be edited. An <strong>in</strong>put dialog with a text <strong>in</strong>put box appears after activat<strong>in</strong>g.<br />
Enter the text for the comment label <strong>in</strong> the <strong>in</strong>put box. Multiple l<strong>in</strong>es can be entered and will appear <strong>in</strong> the comment<br />
label as they appear <strong>in</strong> the text <strong>in</strong>put box.<br />
Comment shape<br />
With this item the shape of the comment label can be selected. Three choices are available: a rectangular shape, a<br />
rectangular shape with rounded corners and an ellipse shape.<br />
Draw arrow<br />
With this item the arrow can be switched on or off. When the arrow is switched on, a check mark is placed <strong>in</strong> front of<br />
the menu item.<br />
Software<br />
27
<strong>DI</strong>-<strong>770</strong> and WINDAQ/Scope Manual<br />
Arrow po<strong>in</strong>t shape<br />
The arrow po<strong>in</strong>t can have different shapes: no po<strong>in</strong>t at all, a square, a circle, a triangle and an arrow. When no po<strong>in</strong>t is<br />
selected, only a l<strong>in</strong>e from the comment label to the end po<strong>in</strong>t of the arrow is drawn. When the arrow po<strong>in</strong>t is selected,<br />
a triangle is drawn that is always po<strong>in</strong>t<strong>in</strong>g away from the comment label. When Draw arrow is switched off, this item<br />
is not available.<br />
Comment colors<br />
With this choice the foreground color and the background color of the comment label and the arrow can be selected.<br />
The foreground color is used for the l<strong>in</strong>e around the comment label, for the text, for the arrow and for the l<strong>in</strong>e around<br />
the arrow po<strong>in</strong>t. The background color is used to fill the comment label and the arrow po<strong>in</strong>t.<br />
Delet<strong>in</strong>g a comment label<br />
To delete a comment label, place the mouse cursor on the comment label to delete and press the right mouse button. A<br />
menu will pop up. Select the Delete comment item to delete the comment label.<br />
Make a hard copy pr<strong>in</strong>t out<br />
To save a measurement on paper, a WYSIWYG hardcopy utility is added.<br />
The pr<strong>in</strong>tout conta<strong>in</strong>s all active signals with the sett<strong>in</strong>gs at the moment of activat<strong>in</strong>g the hardcopy function. All relevant<br />
<strong>in</strong>formation about the signals (sensitivity, offsets, ga<strong>in</strong>s, sampl<strong>in</strong>g frequency, record length etc.) are placed<br />
around the signal display.<br />
A record view <strong>in</strong>dicator is placed <strong>in</strong> the upper right corner of the pr<strong>in</strong>tout, <strong>in</strong>dicat<strong>in</strong>g which part of the measured<br />
record is displayed, where the trigger po<strong>in</strong>t is located and where the cursors are located <strong>in</strong> the record (if switched on).<br />
If cursors are switched on, the cursors are drawn (when <strong>in</strong> the display) and a table with the cursor readout is drawn.<br />
If comment labels are placed, they are pr<strong>in</strong>ted <strong>in</strong> the same way as they appear on the screen.<br />
The hardcopy can be activated <strong>in</strong> three ways: us<strong>in</strong>g the key comb<strong>in</strong>ation , us<strong>in</strong>g the pr<strong>in</strong>t button (<br />
by enter<strong>in</strong>g the File menu and select<strong>in</strong>g the Pr<strong>in</strong>t... item.<br />
) or<br />
A pr<strong>in</strong>t dialog appears <strong>in</strong> which the current selected pr<strong>in</strong>ter is <strong>in</strong>dicated. To change the selected pr<strong>in</strong>ter or the sett<strong>in</strong>gs<br />
of the selected pr<strong>in</strong>ter, press the Setup button. A new dialog appears <strong>in</strong> which another pr<strong>in</strong>ter can be selected or the<br />
sett<strong>in</strong>gs of the current pr<strong>in</strong>ter can be changed.<br />
Note: In theory all paper sizes are supported, but envelope paper sizes will give unusable results. Select<strong>in</strong>g landscape<br />
or portrait has no use, s<strong>in</strong>ce the hardcopy function forces landscape.<br />
When the correct pr<strong>in</strong>ter is selected and all sett<strong>in</strong>gs are made, press the OK button to leave the dialog. Press the Cancel<br />
button to leave the dialog without changes.<br />
The check box Color pr<strong>in</strong>t out determ<strong>in</strong>es whether a color pr<strong>in</strong>tout is made or a black and white pr<strong>in</strong>tout is made.<br />
When this box is checked and the pr<strong>in</strong>ter supports colors, a color pr<strong>in</strong>tout is made. If the pr<strong>in</strong>ter does not support colors,<br />
different shades of gray are created (by the w<strong>in</strong>dows pr<strong>in</strong>ter driver). If the box is not checked, only black is used.<br />
To start pr<strong>in</strong>t<strong>in</strong>g now, press the Pr<strong>in</strong>t button. A dialog appears, <strong>in</strong>dicat<strong>in</strong>g that the hardcopy is generated and sent to<br />
the pr<strong>in</strong>ter.<br />
End<strong>in</strong>g the program<br />
With the right most button <strong>in</strong> the <strong>in</strong>strument taskbar the application can be term<strong>in</strong>ated. The application sett<strong>in</strong>gs and<br />
<strong>in</strong>strument w<strong>in</strong>dow positions are saved on disk.<br />
Software<br />
28
<strong>DI</strong>-<strong>770</strong> and WINDAQ/Scope Manual<br />
6. The <strong>Oscilloscope</strong><br />
The oscilloscope is an <strong>in</strong>strument with which electrical voltages vary<strong>in</strong>g <strong>in</strong> time can be displayed. With the oscilloscope<br />
time dependent electrical signals can be exam<strong>in</strong>ed easily.<br />
The oscilloscope has separated voltage <strong>in</strong>puts, channels, which can be configured <strong>in</strong>dividually. It is a digital sampl<strong>in</strong>g<br />
oscilloscope. That means that the oscilloscope takes samples at fixed times. From each sample the value is determ<strong>in</strong>ed<br />
and the size is displayed at the screen. The screen is filled with all samples. Between two adjacent samples on<br />
the screen a l<strong>in</strong>e is drawn. The speed at which the samples are taken, is adjustable.<br />
Cursors are available to perform voltage, time or frequency measurements on the displayed signal.<br />
The <strong>Oscilloscope</strong><br />
29
<strong>DI</strong>-<strong>770</strong> and WINDAQ/Scope Manual<br />
Alias<strong>in</strong>g<br />
A disadvantage of digital sampl<strong>in</strong>g oscilloscopes is the fact that alias<strong>in</strong>g can occur.<br />
Alias<strong>in</strong>g occurs when a too low and therefor wrong sampl<strong>in</strong>g frequency is used. The next illustration shows how<br />
alias<strong>in</strong>g occurs.<br />
The <strong>in</strong>put signal is a triangular signal with a frequency of 1.25 kHz (upper most <strong>in</strong> the illustration). The signal is sampled<br />
at a frequency of 1 kHz. The dotted signal is the result of the reconstruction. From that triangular signal the periodical<br />
time is 4 ms, which corresponds with an apparent frequency (alias) of 250 Hz (1.25 kHz - 1 kHz).<br />
To avoid alias<strong>in</strong>g, the sample frequency must be greater than 2 times the maximum frequency of the <strong>in</strong>put signal.<br />
If you have any doubts about the displayed signal, you can set the timebase of the oscilloscope <strong>one</strong> step faster or<br />
slower and check whether the signal at the display changes accord<strong>in</strong>gly. If that does not give any clearance, you can<br />
determ<strong>in</strong>e the frequency of the <strong>in</strong>put signal with the spectrum analyzer. Therefore you must set the frequency range of<br />
the spectrum analyzer to the maximum, to avoid alias<strong>in</strong>g with the spectrum analyzer. For more <strong>in</strong>formation, see the<br />
chapter Spectrum Analyzer.<br />
Display<strong>in</strong>g channels<br />
The oscilloscope has several modes to display the two channels. To select the measure mode, enter the Measure menu<br />
and select:<br />
Ch1 measure and display only channel 1<br />
Ch2 measure and display only channel 2<br />
Ch1 and Ch2<br />
measure channel 1 and channel 2 simultaneously and display the values of both channels<br />
Note: When the measure mode Ch1 and Ch2 is selected, display<strong>in</strong>g math signals becomes available.<br />
When only <strong>one</strong> channel is measured, the controls of the other channel are disabled or removed from the display.<br />
Envelope mode<br />
When a signal is monitored and a glitch is expected, envelope mode can be switched on to be sure to see the glitch. In<br />
envelope mode, for each sample <strong>in</strong> the record a highest value and a lowest value is stored. Each measurement is<br />
checked whether the new value lies between the previous highest and lowest or not. If not, the highest or lowest value<br />
The <strong>Oscilloscope</strong><br />
30
<strong>DI</strong>-<strong>770</strong> and WINDAQ/Scope Manual<br />
is changed to the new value. Then a vertical l<strong>in</strong>e is drawn between the lowest and highest value. So a glitch is always<br />
captured.<br />
Envelope mode is reset each time when the sett<strong>in</strong>g of the <strong>in</strong>strument changes (sensitivity, offset, record length etc.),<br />
when the w<strong>in</strong>dow size changes and when the pre def<strong>in</strong>ed reset number is reached. To set the reset number, enter the<br />
Envelope menu, which can be found <strong>in</strong> the Measure menu or by click<strong>in</strong>g the right mouse button on the Envelope<br />
mode button ( ). Select the item Reset envelope after and a menu with the possible option pops up. When the<br />
choice 32 measurements is selected, envelope mode will be reset after 32 measurements. When the choice <strong>in</strong>f<strong>in</strong>ite<br />
measurements is selected, envelope mode will not be reset automatically, only by changes <strong>in</strong> the <strong>in</strong>strument sett<strong>in</strong>gs<br />
or by a w<strong>in</strong>dow size change.<br />
Envelope mode can be switched on by click<strong>in</strong>g the envelope button, by press<strong>in</strong>g the key or be select<strong>in</strong>g the item<br />
Envelope mode from the Measure menu. When envelope mode is switched on, the Envelope button stays down.<br />
Envelope mode is switched off by press<strong>in</strong>g the button aga<strong>in</strong>, press<strong>in</strong>g the key aga<strong>in</strong> or by select<strong>in</strong>g the Envelope<br />
mode menu item aga<strong>in</strong>.<br />
Note: Envelope mode is only a display function. The envelope signal is not stored to disk or pr<strong>in</strong>ted <strong>in</strong> a hardcopy<br />
operation.<br />
Averag<strong>in</strong>g<br />
When a noisy signal is measured, the <strong>in</strong>fluence of the noise can be elim<strong>in</strong>ated by averag<strong>in</strong>g several measurements.<br />
The noise comp<strong>one</strong>nt(s) will disappear and the actual signal rema<strong>in</strong>s.<br />
Averag<strong>in</strong>g can be switched on by select<strong>in</strong>g the item Perform averag<strong>in</strong>g of from the Measure menu. In the next menu a<br />
number of measurements can be selected that have to be averaged. The item 1 measurement will switch off averag<strong>in</strong>g.<br />
Averag<strong>in</strong>g can also be switched on or off by press<strong>in</strong>g the Averag<strong>in</strong>g button ( ).<br />
When averag<strong>in</strong>g is set to e.g. 20 measurements and the oscilloscope is set to Pause, press<strong>in</strong>g the One shot button will<br />
result <strong>in</strong> tak<strong>in</strong>g 20 measurements which are averaged<br />
Averag<strong>in</strong>g is reset each time when the sett<strong>in</strong>g of the <strong>in</strong>strument hardware changes (sensitivity, coupl<strong>in</strong>g, sampl<strong>in</strong>g frequency,<br />
record length etc.) and when the pre def<strong>in</strong>ed reset number is reached.<br />
Note: When a number of pre samples is set, averag<strong>in</strong>g will have a large effect on the shape of the signal <strong>in</strong> the pre<br />
samples because this part of the measured record changes much.<br />
Math mode<br />
The oscilloscope is equipped with a special Math channel. This channel can display the follow<strong>in</strong>g signals:<br />
Ch1 + Ch2<br />
Ch1 - Ch2<br />
Ch2 - Ch1<br />
These are display added or subtracted signals. This means that the on screen signal sizes are added or subtracted. The<br />
position and size of the math signal can be controlled by the software offset and software ga<strong>in</strong> of both channels.<br />
To get a math channel, both channels have to be on. Select<strong>in</strong>g a math channel is d<strong>one</strong> by select<strong>in</strong>g a menu item from<br />
the Math menu. The Math menu can be found <strong>in</strong> the ma<strong>in</strong> menu or can be called by click<strong>in</strong>g the math button ( ).<br />
H<strong>in</strong>t: When the oscilloscope operates <strong>in</strong> split screen mode and ch1 uses the upper half of the screen and ch2 uses the<br />
lower half of the screen, the math channel comes <strong>in</strong> the center of the screen.<br />
The math channel can be switched off aga<strong>in</strong> by select<strong>in</strong>g the item No math from the Math menu.<br />
The <strong>Oscilloscope</strong><br />
31
<strong>DI</strong>-<strong>770</strong> and WINDAQ/Scope Manual<br />
Sett<strong>in</strong>g up a channel<br />
The two channels of the oscilloscope are completely configurable. Both channels are identical, each has its own menu<br />
item <strong>in</strong> the ma<strong>in</strong> menu. S<strong>in</strong>ce the possibilities for both channels are equal, channel 1 is expla<strong>in</strong>ed here. Where channel<br />
1 is described, the same applies to channel 2.<br />
With the menu item Ch1 (or Ch2) from the ma<strong>in</strong> menu a popup menu is called with all sett<strong>in</strong>gs for a channel.<br />
Sett<strong>in</strong>g the sensitivity of a channel<br />
The <strong>in</strong>put sensitivity of a channel determ<strong>in</strong>es how large a certa<strong>in</strong> signal will be displayed, the lower the full scale<br />
value, the larger the signal will be displayed. It is also possible to enable an autorang<strong>in</strong>g function.<br />
The sensitivity can be set through the Sensitivity menu. The Sensitivity menu is called by enabl<strong>in</strong>g the Ch1 menu and<br />
then select<strong>in</strong>g the Sensitivity menu. In this menu the <strong>in</strong>put sensitivities are available. Also an Autorang<strong>in</strong>g sett<strong>in</strong>g is<br />
available. The Sensitivity menu can also be entered by click<strong>in</strong>g the right mouse button over <strong>one</strong> of the Ch1 or Ch2<br />
controls and readouts.<br />
To switch on Autorang<strong>in</strong>g, a special button is available. When auto rang<strong>in</strong>g is switched on, the button caption is Auto,<br />
otherwise it holds the current set <strong>in</strong>put sensitivity. Press<strong>in</strong>g the right mouse button on this button will br<strong>in</strong>g up a menu<br />
with all sensitivities.<br />
Note: When autorang<strong>in</strong>g is switched on, several measurements might be needed to set the <strong>in</strong>put sensitivity, depend<strong>in</strong>g<br />
on the <strong>in</strong>put signal.<br />
Another way to set the sensitivity is by us<strong>in</strong>g the keyboard. A few keys have been reserved for sett<strong>in</strong>g the <strong>in</strong>put sensitivity<br />
of the channels. These keys are:<br />
<br />
<br />
<br />
<br />
Increase Ch1 sensitivity<br />
Decrease Ch1 sensitivity<br />
Increase Ch2 sensitivity<br />
Decrease Ch2 sensitivity<br />
Sett<strong>in</strong>g the signal coupl<strong>in</strong>g of a channel<br />
The <strong>in</strong>put signal can be coupled directly to the ADC (DC) or through a capacitor to the ADC (AC). In the hardware, a<br />
capacitor is switched <strong>in</strong>to (AC) or out of (DC) the signal path.<br />
In COUPLING DC the complete signal (AC+DC) at the <strong>in</strong>put is passed through. In COUPLING AC only the AC<br />
comp<strong>one</strong>nt of the <strong>in</strong>put signal is passed through. It is then possible to exam<strong>in</strong>e e.g. a ±20 mV ripple on a 30 V DC<br />
voltage, s<strong>in</strong>ce only the ripple is passed through and the DC voltage not. AC voltages with a frequency lower than ±4<br />
Hz are not coupled correctly.<br />
There are three different ways to set the coupl<strong>in</strong>g. Two ways are: by click<strong>in</strong>g the coupl<strong>in</strong>g button or by press<strong>in</strong>g keys.<br />
The third way is through the Signal coupl<strong>in</strong>g menu.<br />
The Signal coupl<strong>in</strong>g menu is called by enabl<strong>in</strong>g the Ch1 menu and then select<strong>in</strong>g the Signal coupl<strong>in</strong>g menu. In this<br />
menu the sett<strong>in</strong>gs Coupl<strong>in</strong>g AC and Coupl<strong>in</strong>g DC can be found. The menu can also be entered by click<strong>in</strong>g the right<br />
mouse button over <strong>one</strong> of the Ch1 or Ch2 controls and readouts.<br />
In the tool bar for each channel a coupl<strong>in</strong>g button is found, the coupl<strong>in</strong>g button for Ch1 at the left hand side of the<br />
screen, for Ch2 at the right hand side of the screen. The picture at the button <strong>in</strong>dicates the state of the coupl<strong>in</strong>g sett<strong>in</strong>g.<br />
The left button of the two buttons below is <strong>in</strong>dicat<strong>in</strong>g AC coupl<strong>in</strong>g, the right button is <strong>in</strong>dicat<strong>in</strong>g DC coupl<strong>in</strong>g.<br />
The current coupl<strong>in</strong>g state is displayed <strong>in</strong> the coupl<strong>in</strong>g button.<br />
The <strong>Oscilloscope</strong><br />
32
<strong>DI</strong>-<strong>770</strong> and WINDAQ/Scope Manual<br />
The keys which can be used to change the signal coupl<strong>in</strong>g are:<br />
<br />
<br />
<br />
<br />
sets the coupl<strong>in</strong>g of channel 1 to AC<br />
sets the coupl<strong>in</strong>g of channel 1 to DC<br />
sets the coupl<strong>in</strong>g of channel 2 to AC<br />
sets the coupl<strong>in</strong>g of channel 2 to DC<br />
Sett<strong>in</strong>g the vertical position of a channel<br />
The vertical position of a channel on the screen is software adjustable. When sett<strong>in</strong>g the vertical position of a channel<br />
the signal is adjusted graphically after all the samples have been taken. This only affects the display<strong>in</strong>g of the signal.<br />
If the <strong>in</strong>put signal is clipped, because it is larger than the selected <strong>in</strong>put sensitivity range, and the signal is adjusted,<br />
the signal stays clipped. The clipp<strong>in</strong>g will show very clearly on the screen. The signal is cut off at the top or bottom.<br />
This position<strong>in</strong>g method is ma<strong>in</strong>ly used to move signals which overlap each other on the screen.<br />
The software position<strong>in</strong>g can be changed by us<strong>in</strong>g a menu or by dragg<strong>in</strong>g the vertical axes. To adjust the offset by<br />
means of a menu, enter the Ch1 menu and select the choice Software offset ... A dialog box appears <strong>in</strong> which the offset<br />
can be entered. The value is <strong>in</strong> Volts.<br />
The easiest way of adjust<strong>in</strong>g the offset is by dragg<strong>in</strong>g the axis. This is d<strong>one</strong> by press<strong>in</strong>g the left mouse button with<strong>in</strong><br />
the vertical axis, but not over the <strong>in</strong>verted area (on the top and bottom of the axes) and mov<strong>in</strong>g the mouse up or down<br />
while keep<strong>in</strong>g the mouse button pressed.<br />
Magnify<strong>in</strong>g or reduc<strong>in</strong>g the vertical axis<br />
The measured values can be magnified or reduced by the software, by the Software ga<strong>in</strong>. By do<strong>in</strong>g this, the vertical<br />
axes can be made larger or smaller.<br />
This can be used to display two signals of different sizes on the screen, to be compared more easily. For example: Ch1<br />
is measur<strong>in</strong>g a 5 Volt signal, Ch2 is measur<strong>in</strong>g a 4 volt signal. Set the ga<strong>in</strong> of Ch1 to 0.8 and the ga<strong>in</strong> of Ch2 to 1.<br />
Both signals are displayed with the same size.<br />
Another application is to display two signals <strong>in</strong> a 'split screen mode'. By sett<strong>in</strong>g the ga<strong>in</strong> of the channels to 0.5 and the<br />
offset of Ch1 2 divs up and the offset of Ch2 2 divs down, the channels are displayed separately.<br />
The software ga<strong>in</strong> can be changed by us<strong>in</strong>g a menu or by dragg<strong>in</strong>g the vertical axes. To adjust the software ga<strong>in</strong><br />
through the menu, enter the Ch1 menu and select the choice Software ga<strong>in</strong>... A dialog box appears <strong>in</strong> which the ga<strong>in</strong><br />
can be entered. The value of the ga<strong>in</strong> has to be between 0.25 and 4, where values smaller than 1 make the signal<br />
appear smaller and values larger than 1 make the signal appear larger. To change the software ga<strong>in</strong> by dragg<strong>in</strong>g the<br />
vertical axis, place the mouse po<strong>in</strong>ter over either the upper most or the lower most label of the vertical axis. These<br />
labels are drawn <strong>in</strong>verted. When the mouse po<strong>in</strong>ter is over <strong>one</strong> of these labels, press the left mouse button and drag<br />
the label upwards or downwards, thereby enlarg<strong>in</strong>g or shr<strong>in</strong>k<strong>in</strong>g the axis and the signal.<br />
Invert<strong>in</strong>g a channel<br />
With the software it is possible to <strong>in</strong>vert the signal of a channel. This software <strong>in</strong>vert multiplies all measured values<br />
by -1 and adapts the values along the vertical axis accord<strong>in</strong>gly.<br />
There are three ways to <strong>in</strong>vert a signal: by means of a menu, by means the keyboard and by press<strong>in</strong>g the <strong>in</strong>vert button.<br />
The Invert menu is found <strong>in</strong> the Ch1 menu. In this menu two choices are available to switch the <strong>in</strong>vert on or off.<br />
A few keys have been reserved to set the <strong>in</strong>vert:<br />
toggles the <strong>in</strong>vert of channel 1<br />
toggles the <strong>in</strong>vert of channel 2<br />
The <strong>Oscilloscope</strong><br />
33
<strong>DI</strong>-<strong>770</strong> and WINDAQ/Scope Manual<br />
In the tool bar for each channel an <strong>in</strong>vert button is found, the <strong>in</strong>vert button for Ch1 at the left hand side of the screen,<br />
for Ch2 at the right hand side of the screen. The picture at the button <strong>in</strong>dicates the state of the <strong>in</strong>vert sett<strong>in</strong>g. The left<br />
button of the two buttons below is <strong>in</strong>dicat<strong>in</strong>g Invert On, the right button is <strong>in</strong>dicat<strong>in</strong>g Invert Off.<br />
The channel view button<br />
For controll<strong>in</strong>g the software offset and the software ga<strong>in</strong> some pre def<strong>in</strong>ed sett<strong>in</strong>gs are available by press<strong>in</strong>g the channel<br />
view button.<br />
These sett<strong>in</strong>gs are:<br />
offset = 0 and ga<strong>in</strong> = 1 (us<strong>in</strong>g full screen)<br />
offset = +0.5 <strong>in</strong>put sensitivity and ga<strong>in</strong> = 0.5 (upper half of the screen)<br />
offset = -0.5 <strong>in</strong>put sensitivity and ga<strong>in</strong> = 0.5 (lower half of the screen)<br />
offset and ga<strong>in</strong> have the last value set by the user<br />
These sett<strong>in</strong>gs are available by press<strong>in</strong>g the channel view button. Each sett<strong>in</strong>g has its own picture on the button. The<br />
image below displays the above menti<strong>one</strong>d sett<strong>in</strong>gs from left to right.<br />
The image at the button <strong>in</strong>dicates the current sett<strong>in</strong>gs. Each click on the button will select the next state. If the offset<br />
or ga<strong>in</strong> are changed by other means and <strong>one</strong> of the predef<strong>in</strong>ed states is obta<strong>in</strong>ed, the button will go to that state as<br />
well, otherwise user is displayed.<br />
The channel view button for channel 1 is found at the left hand side of the display, for channel 2 at the right hand side<br />
of the display.<br />
Chang<strong>in</strong>g the units of the vertical axis<br />
Along the vertical axis, normally the voltage of the <strong>in</strong>put signal is projected. The unit of measure is then Volt and the<br />
numbers along the axis correspond with the size of the <strong>in</strong>put signal.<br />
The oscilloscope allows you to create another def<strong>in</strong>ition of the vertical axis.<br />
By means of the choice Units of measure from the Ch1 menu the units of measure of the vertical axis can be changed.<br />
After activation, a popup menu with 13 choices appears. The unit that is selected, is displayed at the top of the vertical<br />
axis. It is also placed on the paper when pr<strong>in</strong>ted out. When activat<strong>in</strong>g the choice User def<strong>in</strong>ed ... a dialog box appears,<br />
<strong>in</strong> which a custom unit can be entered, with a maximum length of 5 characters.<br />
The Units of measure popup menu can also be called by click<strong>in</strong>g the right mouse button over the vertical axes.<br />
If you are measur<strong>in</strong>g e.g. with a temperature probe, you can choose DEGREE C for the units.<br />
By activat<strong>in</strong>g the choice Units ga<strong>in</strong>... from the Ch1 menu, a multiplication factor can be entered for the units of the<br />
vertical axis. A dialog box appears <strong>in</strong> which the factor can be entered. The numbers along the vertical axis are multiplied<br />
by the factor and replaced by the result.<br />
If you are us<strong>in</strong>g a 10x probe, you can by means of units ga<strong>in</strong> enter the value 10, to get correct numbers along the vertical<br />
axis.<br />
Another application is when measur<strong>in</strong>g with a temperature probe. Suppose the temperature probe gives a voltage<br />
change of 1 volt at a temperature change of 5 degrees. By enter<strong>in</strong>g the factor 5, the temperature change is displayed<br />
directly <strong>in</strong> the number of degrees.<br />
The <strong>Oscilloscope</strong><br />
34
<strong>DI</strong>-<strong>770</strong> and WINDAQ/Scope Manual<br />
It is also possible to add an offset to the numbers of the vertical axis. In the dialog box called by activat<strong>in</strong>g Units offset...<br />
from the Ch1 menu, an offset can be entered. This offset is added to the numbers along the vertical axis. Noth<strong>in</strong>g<br />
is d<strong>one</strong> to the signal.<br />
An application for this is the temperature measurement. Suppose the output voltage of the temperature probe at 0 C is<br />
+10 Volt. By enter<strong>in</strong>g a units offset of -10, the zero level of the axis is changed <strong>in</strong> a way that the absolute temperature<br />
is directly readable.<br />
Mouse sensitivity for the vertical axis<br />
For dragg<strong>in</strong>g the vertical axis, the mouse sensitivity can be adjusted from course to f<strong>in</strong>e, from 1 step per division to<br />
25 steps per division.<br />
When a mouse sensitivity of 1 step per division is selected, each mouse movement will make the software offset<br />
become <strong>one</strong> division larger or smaller. When the software ga<strong>in</strong> is adjusted, it will result <strong>in</strong> a two division smaller or<br />
larger signal size (<strong>one</strong> division at the top and <strong>one</strong> division at the bottom of the signal).<br />
When the mouse sensitivity is set to 25 steps per division each mouse movement will result <strong>in</strong> an offset change of 1/<br />
25th division or a signal size change of 2/25th division.<br />
The mouse sensitivity can be set by select<strong>in</strong>g the item Mouse sensitivity vertical axis from the Ch1 menu.<br />
Sett<strong>in</strong>g up the time axis<br />
Along the horizontal axis of an oscilloscope the measur<strong>in</strong>g time is projected. The measur<strong>in</strong>g time is determ<strong>in</strong>ed by<br />
the number of samples that is measured and the sample frequency<br />
Sett<strong>in</strong>g the sample frequency<br />
The sample frequency determ<strong>in</strong>es the speed with which the <strong>in</strong>strument will take samples of the <strong>in</strong>put signal(s).<br />
The sample frequency can be set <strong>in</strong> two ways: us<strong>in</strong>g the menu of by means of special function keys.<br />
To change the sample frequency us<strong>in</strong>g the menu, enter the Time base menu and select the Sample frequency item. A<br />
new menu will appear with all possible sample frequency sett<strong>in</strong>gs. Together with the sample frequency the maximum<br />
total measure time with the current record length and a pre trigger value of 0% is given. The Time base menu can also<br />
be entered by press<strong>in</strong>g the right mouse button over <strong>one</strong> of the time base controls or read outs.<br />
The last item <strong>in</strong> the menu is a user def<strong>in</strong>ed sett<strong>in</strong>g. Activat<strong>in</strong>g this item will br<strong>in</strong>g up a dialog box <strong>in</strong> which a self<br />
def<strong>in</strong>ed sample frequency (with<strong>in</strong> the <strong>in</strong>strument hardware limitations) can be entered. Due to the way the sample frequency<br />
is generated <strong>in</strong> the hardware, not all frequencies can be generated. If an <strong>in</strong>valid sample frequency is entered,<br />
the closest valid sample frequency will be generated.<br />
The follow<strong>in</strong>g keys can be used to change the sample frequency:<br />
<br />
<br />
Set the sample frequency <strong>one</strong> step slower<br />
Set the sample frequency <strong>one</strong> step faster<br />
Note: Because the record length, the number of post samples and the record view<strong>in</strong>g ga<strong>in</strong> are free settable, it is very<br />
difficult to set the time base <strong>in</strong> a certa<strong>in</strong> number of sec/div. Therefor the sampl<strong>in</strong>g frequency is set.<br />
Sett<strong>in</strong>g the record length<br />
The oscilloscope takes a number of samples to display the <strong>in</strong>put signal. This number of samples is called the Record<br />
length. To change the record length, two ways are available: by means of a menu or by means of function keys.<br />
To change the record length us<strong>in</strong>g the menu, enter the Time base menu and select the Record length item. Another<br />
menu will pop up, conta<strong>in</strong><strong>in</strong>g the available record lengths and an item for a user def<strong>in</strong>ed record length. Select<strong>in</strong>g this<br />
item will br<strong>in</strong>g up a dialog box <strong>in</strong> which a self def<strong>in</strong>ed record length (with<strong>in</strong> the <strong>in</strong>strument hardware limits) can be<br />
The <strong>Oscilloscope</strong><br />
35
<strong>DI</strong>-<strong>770</strong> and WINDAQ/Scope Manual<br />
entered. The Time base menu can also be entered by press<strong>in</strong>g the right mouse button over <strong>one</strong> of the time base controls<br />
or read outs.<br />
For chang<strong>in</strong>g the record length the follow<strong>in</strong>g function keys are available:<br />
<br />
<br />
Select a shorter record length<br />
Select a longer record length<br />
Select<strong>in</strong>g another record length will change the total measure time, but the pre trigger value will keep the same value.<br />
Sett<strong>in</strong>g the pre trigger value<br />
The oscilloscope is equipped with a trigger system. This trigger system monitors the <strong>in</strong>put signal(s) and determ<strong>in</strong>es,<br />
based on the sett<strong>in</strong>gs of the trigger system and the <strong>in</strong>put signal, when measur<strong>in</strong>g and display<strong>in</strong>g the signal(s) has to<br />
start.<br />
The moment of trigger, the trigger po<strong>in</strong>t, can be placed at any position <strong>in</strong> the record with measured data. This will<br />
result <strong>in</strong> a certa<strong>in</strong> number of samples before the trigger po<strong>in</strong>t (pre samples) and a number of samples after the trigger<br />
po<strong>in</strong>t (post samples). Pre and post samples together form the record length. The position of the trigger po<strong>in</strong>t is<br />
referred to as the pre trigger value, <strong>in</strong>dicat<strong>in</strong>g how many pre samples are recorded <strong>in</strong> the total record. Usually (and<br />
default) this number is given <strong>in</strong> a percentage of the record length, but it can be given <strong>in</strong> a number of samples or <strong>in</strong> a<br />
time value as well.<br />
To change the pre trigger value, two ways are possible: by a menu or with the special trigger position scroll bar,<br />
which is located below the signal display.<br />
This special scroll bar represents the complete record and the slider (^) represents the trigger po<strong>in</strong>t. In the above picture,<br />
the trigger po<strong>in</strong>t is set to 25%. To change the trigger po<strong>in</strong>t, place your mouse po<strong>in</strong>ter over the arrow (the mouse<br />
po<strong>in</strong>ter will change shape), press the left mouse button and drag the slider to the position you want it to have. When<br />
<strong>one</strong> of the small buttons at the left hand side or the right hand side of the scroll bar are clicked, the pre trigger value<br />
will change by 1%.<br />
When the mouse is clicked with<strong>in</strong> the scroll bar, but not on the slider, the pre trigger value will <strong>in</strong>crease or decrease<br />
by 5%, depend<strong>in</strong>g on whether the mouse is clicked to the right or to the left of the slider. When the mouse button<br />
rema<strong>in</strong>s pressed, an auto repeat function will be activated.<br />
To change the pre trigger value by us<strong>in</strong>g the menu, enter the Time base menu and select the Pre trigger value item.<br />
this will br<strong>in</strong>g up a menu with 5 pre trigger value options and a user def<strong>in</strong>ed option.<br />
The pre trigger value options are default given <strong>in</strong> a percentage, but can be given <strong>in</strong> a number of samples or <strong>in</strong> time. To<br />
do that, first the user def<strong>in</strong>ed option has to be selected. The Time base menu can also be entered by press<strong>in</strong>g the right<br />
mouse button over <strong>one</strong> of the time base controls or read outs.<br />
When the user def<strong>in</strong>ed option is selected, a dialog box appears. In this dialog box can be selected <strong>in</strong> what unit the pre<br />
trigger value has to be entered (percentage, samples or time) and what the pre trigger value has to be. When the dialog<br />
box is closed us<strong>in</strong>g the OK button, the entered value is accepted and the selected unit will be used the next time the<br />
pre trigger value menu is called.<br />
Mouse sensitivity pre trigger position adjustment<br />
For adjust<strong>in</strong>g the pre trigger value by dragg<strong>in</strong>g the slider of the pre trigger position scroll bar, the mouse sensitivity<br />
can be adjusted from course to f<strong>in</strong>e, from 4 steps per screen to 100 steps per screen.<br />
When a mouse sensitivity of 4 steps per screen is selected, the pre trigger position scroll bar is divided <strong>in</strong> 4 positions.<br />
Each mouse movement will adjust the pre trigger value to the next position <strong>in</strong> the direction the mouse is moved. So<br />
the available pre trigger positions are 0%, 25%, 50%, 75% and 100%.<br />
The <strong>Oscilloscope</strong><br />
36
<strong>DI</strong>-<strong>770</strong> and WINDAQ/Scope Manual<br />
When a mouse sensitivity of 10 steps per screen is selected, the available pre trigger positions are 0%, 10%, 20%,<br />
30%, ..., 90% and 100%.<br />
When the mouse sensitivity is set to 100 steps per screen each mouse movement will result <strong>in</strong> a pre trigger value<br />
change of 1%.<br />
Note: The mouse sensitivity does not affect adjust<strong>in</strong>g the pre trigger value by click<strong>in</strong>g the buttons of the scroll bar or<br />
by click<strong>in</strong>g <strong>in</strong> the scrollbar outside the slider.<br />
To set the Mouse sensitivity, enter the Time base menu and select Mouse sensitivity pre trigger position adjustment.<br />
In the menu that pops up, the choices are available.<br />
Magnify<strong>in</strong>g the horizontal axis<br />
The software supports a wide range of record lengths which can all been viewed completely. A special display<strong>in</strong>g<br />
algorithm guarantees that when-ever the record length is larger than the display size, no amplitude <strong>in</strong>formation will<br />
be lost.<br />
To take a closer look at a smaller part of the record, that part can be magnified to fill the screen. This is d<strong>one</strong> with the<br />
record view ga<strong>in</strong>, which is completely variable between 1.0 (full record view) and a value depend<strong>in</strong>g on the <strong>in</strong>strument<br />
w<strong>in</strong>dow width (about 40 - about 80).<br />
Adjust<strong>in</strong>g the record view ga<strong>in</strong> can be d<strong>one</strong> through a menu and by means of the special record view scroll bar.<br />
To change the record view ga<strong>in</strong> by means of a menu, enter the Time base menu and select the Record view ga<strong>in</strong> item.<br />
This will br<strong>in</strong>g up a dialog box <strong>in</strong> which the requested record view ga<strong>in</strong> can be entered. The Time base menu can also<br />
be entered by press<strong>in</strong>g the right mouse button over <strong>one</strong> of the time base controls or read outs.<br />
Sett<strong>in</strong>g the horizontal position of the signal(s)<br />
When a record view ga<strong>in</strong> > 1 is selected, only a part of the record is visible. To view a certa<strong>in</strong> part of the record, a<br />
record view offset can be applied.<br />
Apply<strong>in</strong>g a record view offset can be d<strong>one</strong> by means of the special record view scroll bar and by means of a menu.<br />
To use the menu, enter the Time base menu and select the Record view offset item. A dialog box will appear <strong>in</strong> which<br />
the record view offset can be entered, <strong>in</strong> seconds. When the trigger position is not equal to 0, a negative value will<br />
make pre samples visible, a positive value will make post samples visible. The Time base menu can also be entered<br />
by press<strong>in</strong>g the right mouse button over <strong>one</strong> of the time base controls or read outs.<br />
When the record view ga<strong>in</strong> is equal to 1.0, the Record view offset item is not available <strong>in</strong> the menu.<br />
The record view scroll bar<br />
For an easy way of adjust<strong>in</strong>g the record view ga<strong>in</strong> and the record view offset, the oscilloscope is equipped with a special<br />
record view scroll bar, located under the signal display.<br />
The dark gray part of the scroll bar represents the measured record, the slider (light gray) represents the visible part of<br />
the record. The red l<strong>in</strong>es represent the position of the cursors. If the cursors are not switched on, no red l<strong>in</strong>es are visible.<br />
To change the record view ga<strong>in</strong>, place the mouse po<strong>in</strong>ter on the left hand side or the right hand side of the slider (the<br />
mouse po<strong>in</strong>ter will change shape), click the left mouse button and drag the side of the slider to the position you want.<br />
Simultaneously the record view ga<strong>in</strong> will be adjusted and the signal <strong>in</strong> the display changes accord<strong>in</strong>gly.<br />
Note: The m<strong>in</strong>imum slider width is 10 display pixels and the scroll bar width is dependent of the w<strong>in</strong>dow size, so the<br />
maximum ga<strong>in</strong> is limited to (scroll bar width <strong>in</strong> pixels / 10). With a large w<strong>in</strong>dow, the record view ga<strong>in</strong> can be set to a<br />
larger value than with a small w<strong>in</strong>dow size.<br />
The <strong>Oscilloscope</strong><br />
37
<strong>DI</strong>-<strong>770</strong> and WINDAQ/Scope Manual<br />
To change the record view offset, place the mouse po<strong>in</strong>ter anywhere on the slider, except on the left hand side or the<br />
right hand side. The mouse po<strong>in</strong>ter will not change shape. Press the left mouse button and drag the slider to the position<br />
you want. The record view offset will be adjusted and the signal <strong>in</strong> the display changes accord<strong>in</strong>gly.<br />
When the small buttons are clicked, the record view offset is <strong>in</strong>creased or decreased by 1 sample. When the mouse is<br />
clicked with<strong>in</strong> the scroll bar but outside the slider, the record view offset is <strong>in</strong>creased or decreased by 5 samples,<br />
depend<strong>in</strong>g on which side of the scroll bar is clicked. When the mouse button is kept pressed, an auto repeat function<br />
is activated.<br />
Trigger<strong>in</strong>g<br />
To be able to exam<strong>in</strong>e a signal, the moment of display<strong>in</strong>g the signal has to be adjustable. Therefore an oscilloscope is<br />
equipped with a trigger<strong>in</strong>g system. This functions as follows:<br />
The <strong>in</strong>put signal is compared with two levels <strong>in</strong> the trigger system: the arm<strong>in</strong>g level and the fir<strong>in</strong>g level. When the<br />
<strong>in</strong>put signal passes the arm<strong>in</strong>g level, the trigger system is armed. If the <strong>in</strong>put signal passes the fir<strong>in</strong>g level, the trigger<br />
system becomes active and 'fires' a pulse. This pulse is used to start the display of the signal.<br />
The arm<strong>in</strong>g level and the fir<strong>in</strong>g level are coupled to each other by the trigger hysteresis and their level is determ<strong>in</strong>ed<br />
by the trigger level. The fir<strong>in</strong>g level corresponds to the trigger level. The trigger hysteresis def<strong>in</strong>es at which signal<br />
size change can be triggered, the change has to be that large that both levels are passed. With a small trigger hysteresis<br />
it is possible to trigger on small signals. If a signal conta<strong>in</strong>s a lot of noise, a small trigger hysteresis causes trigger<strong>in</strong>g<br />
on the noise, <strong>in</strong>stead of the orig<strong>in</strong>al signal, which gives an unstable display. A trigger hysteresis larger than the noise<br />
level is then necessary.<br />
In the illustration a signal and the two levels are displayed. In this case it is triggered on the ris<strong>in</strong>g slope of the signal.<br />
The signal passes the two levels from low to high. When trigger<strong>in</strong>g on the fall<strong>in</strong>g slope of a signal, the two levels are<br />
swapped. Then the signal has to pass the two levels from high to low, to generate a trigger.<br />
Select<strong>in</strong>g the trigger source<br />
The trigger system can have different sources to determ<strong>in</strong>e when measur<strong>in</strong>g has to start. These sources are:<br />
Ch1 Trigger on channel 1<br />
Ch2 Trigger on channel 2<br />
External<br />
Ch1 AND Ch2<br />
Ch1 OR Ch2<br />
Trigger on the external trigger <strong>in</strong>put<br />
Trigger on channel 1 and channel 2; the signals on both channels have to meet their trigger sett<strong>in</strong>gs<br />
Trigger on channel 1 or channel 2; only <strong>one</strong> of signals has to meet its trigger sett<strong>in</strong>g.<br />
The <strong>Oscilloscope</strong><br />
38
<strong>DI</strong>-<strong>770</strong> and WINDAQ/Scope Manual<br />
To change the trigger source, enter the Trigger menu and select the Source item. In this menu a source can be<br />
selected. The trigger menu can be found <strong>in</strong> the ma<strong>in</strong> menu and can be called by click<strong>in</strong>g the trigger button (<br />
) or<br />
by press<strong>in</strong>g the right mouse button when the mouse is over <strong>one</strong> of the trigger controls or readouts.<br />
Select<strong>in</strong>g the trigger mode<br />
The trigger system has several trigger modes:<br />
Ris<strong>in</strong>g slope<br />
Fall<strong>in</strong>g slope<br />
trigger on the ris<strong>in</strong>g slope of a signal<br />
trigger on the fall<strong>in</strong>g slope of a signal<br />
To change the trigger mode, enter the Trigger menu and select the Trigger mode item. A menu will popup and a trigger<br />
mode selection can be made. Another way to change the trigger mode is by us<strong>in</strong>g the trigger symbol. Double<br />
click<strong>in</strong>g the left mouse button on the trigger symbol will change the trigger mode from:<br />
Fall<strong>in</strong>g slope to Ris<strong>in</strong>g slope<br />
Ris<strong>in</strong>g slope to Fall<strong>in</strong>g slope<br />
Sett<strong>in</strong>g the trigger level<br />
Adjust<strong>in</strong>g a trigger level can be d<strong>one</strong> is several ways: by means of a menu or by us<strong>in</strong>g the special trigger symbol.<br />
To change a trigger level by means of a menu, enter the Trigger menu and select the Level Ch1 ... or Level Ch2 ...<br />
item. An <strong>in</strong>put dialog appears <strong>in</strong> which the trigger level can be entered, <strong>in</strong> volts.<br />
In this dialog, also a check box for select<strong>in</strong>g auto level trigger<strong>in</strong>g is found. When auto level trigger<strong>in</strong>g is selected, the<br />
trigger level will be set to a value that lies <strong>in</strong> the middle between the highest and the lowest value of the previous<br />
measurement. This can be very useful with cont<strong>in</strong>uously chang<strong>in</strong>g signals. When auto level trigger<strong>in</strong>g is selected, the<br />
trigger symbol will show that with a letter A <strong>in</strong> the symbol. The level can no longer be adjusted with the symbol.<br />
Note: When a trigger source External is selected the trigger level adjustment is disabled.<br />
Sett<strong>in</strong>g the trigger hysteresis<br />
Adjust<strong>in</strong>g a trigger hysteresis can be d<strong>one</strong> <strong>in</strong> several ways: by means of a menu or by us<strong>in</strong>g the special trigger symbol.<br />
To change a trigger hysteresis by means of a menu, enter the Trigger menu and select the Hysteresis Ch1 ... or Hysteresis<br />
Ch2 ... item. An <strong>in</strong>put dialog appears <strong>in</strong> which the trigger hysteresis can be entered, <strong>in</strong> volts.<br />
When auto level trigger<strong>in</strong>g is selected, the trigger symbol will show that with a letter A <strong>in</strong> the symbol. The hysteresis<br />
can still be adjusted with the symbol.<br />
Note: When a trigger source External is selected the trigger hysteresis adjustment is disabled.<br />
The trigger symbol<br />
The oscilloscope is equipped with a special trigger symbol, that is used to adjust the trigger level, the trigger hysteresis<br />
and the trigger mode. The WYSIWYG trigger symbol is found at the left hand side or the right hand side of the<br />
signal display, depend<strong>in</strong>g on the trigger source.<br />
The <strong>Oscilloscope</strong><br />
39
<strong>DI</strong>-<strong>770</strong> and WINDAQ/Scope Manual<br />
In the above picture, the trigger mode of the left hand symbol is set to Ris<strong>in</strong>g slope and the trigger mode of the right<br />
hand symbol is set to Fall<strong>in</strong>g slope.<br />
To adjust the trigger level us<strong>in</strong>g the trigger symbol, place the mouse po<strong>in</strong>ter on the trigger symbol, <strong>in</strong> the area that is<br />
marked adjust trigger level <strong>in</strong> the above picture. The mouse po<strong>in</strong>ter will change to a symbol. Press the left mouse<br />
button and drag the trigger symbol to the correct position, while keep<strong>in</strong>g the left mouse button pressed. While dragg<strong>in</strong>g,<br />
the trigger level is adjusted accord<strong>in</strong>g the position of the trigger symbol on the screen. When the mouse button<br />
is released, trigger level adjustment stops and the normal mouse po<strong>in</strong>ter shape is returned.<br />
To adjust the trigger hysteresis us<strong>in</strong>g the trigger symbol, place the mouse po<strong>in</strong>ter on the trigger symbol, <strong>in</strong> the area<br />
that is marked adjust trigger hysteresis <strong>in</strong> the above picture. The mouse po<strong>in</strong>ter will change to a symbol. Press<br />
the left mouse button and drag the hysteresis level of the trigger symbol to the correct position, while keep<strong>in</strong>g the left<br />
mouse button pressed. While dragg<strong>in</strong>g, the trigger hysteresis is adjusted accord<strong>in</strong>g the size of the trigger symbol.<br />
When the mouse button is released, trigger hysteresis adjustment stops and the normal mouse po<strong>in</strong>ter shape is<br />
returned.<br />
To adjust the trigger mode us<strong>in</strong>g the trigger symbol, place the mouse po<strong>in</strong>ter on the trigger symbol and double click<br />
the left mouse button. The trigger mode will change from:<br />
Fall<strong>in</strong>g slope to Ris<strong>in</strong>g slope<br />
Ris<strong>in</strong>g slope to Fall<strong>in</strong>g slope<br />
The trigger time out<br />
When the <strong>in</strong>put signal does not meet the trigger conditions, no new measurement data will be displayed and the last<br />
displayed signal will rema<strong>in</strong> on the screen. This can be very <strong>in</strong>convenient with unknown signals, s<strong>in</strong>ce it is not known<br />
how the trigger system has to be set. To provide <strong>in</strong> that case for a representation of the <strong>in</strong>put signal on the screen, a<br />
trigger time out sett<strong>in</strong>g is available.<br />
With the time out sett<strong>in</strong>g it is determ<strong>in</strong>ed how long the delay will be for a trigger pulse. If that time expires, a trigger<br />
pulse is forced by the software and the available data will be displayed. This will not result <strong>in</strong> a stable display, but it<br />
will give an impression how the trigger has to be set.<br />
To set the trigger time out, enter the Trigger menu and select the Time out ... item. An <strong>in</strong>put dialog will come up <strong>in</strong><br />
which the time out time can be entered, <strong>in</strong> seconds.<br />
When a time of zero is entered, there will be no trigger time out, but no trigger<strong>in</strong>g as well. As soon as a signal is displayed,<br />
the <strong>in</strong>strument will be set up for a new measurement and immediately a trigger pulse is generated, without<br />
wait<strong>in</strong>g for a trigger. This can be useful when e.g. a slowly chang<strong>in</strong>g DC level has to be monitored, on which can't be<br />
triggered.<br />
In the dialog also a check box for an <strong>in</strong>f<strong>in</strong>ite time out is available. When this box is checked, the software will keep<br />
wait<strong>in</strong>g for the <strong>in</strong>put signal to meet the trigger sett<strong>in</strong>gs, without ever forc<strong>in</strong>g a trigger pulse. This can be very useful <strong>in</strong><br />
<strong>one</strong> shot measurements and with auto disk measur<strong>in</strong>g.<br />
Perform<strong>in</strong>g measurements<br />
When the oscilloscope is completely set up, measurements can be performed.<br />
By default the oscilloscope is always measur<strong>in</strong>g and display<strong>in</strong>g. Changes that are made <strong>in</strong> the sett<strong>in</strong>gs can be made<br />
while measur<strong>in</strong>g and will be executed while measur<strong>in</strong>g, so the effects are immediately visible.<br />
Stopp<strong>in</strong>g the measurements<br />
To avoid a new screen of measurement data replac<strong>in</strong>g an old screen, measur<strong>in</strong>g and display<strong>in</strong>g of data can be stopped.<br />
This can be d<strong>one</strong> <strong>in</strong> several ways: by press<strong>in</strong>g the Pause button (<br />
item Stop cont<strong>in</strong>uous measur<strong>in</strong>g from the Measure menu.<br />
), by press<strong>in</strong>g the key or by activat<strong>in</strong>g the<br />
The <strong>Oscilloscope</strong><br />
40
<strong>DI</strong>-<strong>770</strong> and WINDAQ/Scope Manual<br />
When measur<strong>in</strong>g is stopped, the latest measured data will rema<strong>in</strong> on the screen. The Pause button changes to a Play<br />
button ( ) and the One shot button ( ) becomes available.<br />
The measured signal can now be exam<strong>in</strong>ed.<br />
To perform a s<strong>in</strong>gle measurement, press the One shot button, press the key or activate the Perform a s<strong>in</strong>gle measurement<br />
item from the Measure menu.<br />
Cont<strong>in</strong>uous measur<strong>in</strong>g can be started aga<strong>in</strong> by press<strong>in</strong>g the Play button, the key or the item Start cont<strong>in</strong>uous measur<strong>in</strong>g<br />
from the Measure menu. The One shot button will be disabled aga<strong>in</strong>.<br />
Perform Auto disk measurements<br />
The oscilloscope can store measurement data automatically on disk. This is very useful when e.g. an <strong>in</strong>terference<br />
glitch has to be measured. Suppose that at unpredictable times a glitch occurs. By us<strong>in</strong>g the auto disk measurements,<br />
the oscilloscope will wait for the glitch to occur. When the glitch occurs, it is measured and the data is stored on disk.<br />
The time and date of the measurement are stored as well.<br />
To activate the auto disk function, first set up the oscilloscope to the appropriate sett<strong>in</strong>gs (<strong>in</strong>put sensitivity, sample<br />
frequency, record length etc.) Then, enter the Measure menu and select the Auto disk item. A special auto disk dialog<br />
will appear. In this dialog, a target disk, a target directory and a name for the files can be selected. For the file name,<br />
only 5 characters can be entered, three characters will be added by the software for a file serial number. At the bottom<br />
of the dialog a bar graph is display<strong>in</strong>g the available disk space on the selected drive.<br />
The trigger system of the oscilloscope has a time out function. When the <strong>in</strong>put signal does not meet the trigger conditions<br />
with<strong>in</strong> a certa<strong>in</strong> time, a trigger is forced. This is used to see an unknown signal. This feature can be unwanted <strong>in</strong><br />
the auto disk function, therefor a Time out <strong>in</strong>f<strong>in</strong>ite check mark is available to set the time out to <strong>in</strong>f<strong>in</strong>ite. Then the<br />
oscilloscope will keep wait<strong>in</strong>g for the <strong>in</strong>put signal to meet the trigger conditions.<br />
When all is set, press the Start button to start the auto disk measurements. The Cancel button will change to a Stop<br />
button and measur<strong>in</strong>g takes place.<br />
The auto disk measurements stop when the Stop button is pressed or when the disk is full.<br />
Note: In the root of a disk only 128 files can be stored. A RAM drive has a user def<strong>in</strong>able number of entries (default<br />
64) and can store no more files than there are entries available. The auto disk function will stop with a disk full error<br />
when this number of files are written. However, DOS or W<strong>in</strong>dows might still report a certa<strong>in</strong> amount of free space on<br />
the disk. To be able to store more files, create a directory on the disk and store the files <strong>in</strong> that directory. A directory<br />
can conta<strong>in</strong> many more files.<br />
Note: The auto disk function can store only 999 files, due to the three characters that are used for creat<strong>in</strong>g the file<br />
serial number.<br />
Auto setup<br />
When an unknown signal is connected to the oscilloscope, the easiest way to setup the oscilloscope is by us<strong>in</strong>g the<br />
Auto setup function.<br />
The Auto setup function is activated by select<strong>in</strong>g the item Auto setup from the Measure menu or by press<strong>in</strong>g the Auto<br />
setup button ( ).<br />
This function sets the sensitivity for both channels to auto rang<strong>in</strong>g, so the optimal signal size is obta<strong>in</strong>ed. Also the<br />
trigger level of the channel that is the trigger source is set to auto level, to <strong>in</strong>sure there is always a trigger.<br />
Then the time base is set <strong>in</strong> a way that the signal at the channel that is triggered on, is displayed with 2 to 6 periods.<br />
The auto setup function does noth<strong>in</strong>g to the signal coupl<strong>in</strong>g, the measure mode (ch1, ch2 or ch1 and ch2) or the trigger<br />
source.<br />
The <strong>Oscilloscope</strong><br />
41
<strong>DI</strong>-<strong>770</strong> and WINDAQ/Scope Manual<br />
Zoom<strong>in</strong>g<br />
When a certa<strong>in</strong> part of the screen has to be enlarged to full screen, the zoom function is the easiest way to do that.<br />
The zoom function is activated by press<strong>in</strong>g the zoom button ( ). This button stays down until the zoom function is<br />
f<strong>in</strong>ished.<br />
When the zoom function is activated, a rectangular area <strong>in</strong> the signal display can be selected with the mouse. Place<br />
the mouse at <strong>one</strong> of the corners of the rectangle, press the left mouse button, keep it pressed and drag the mouse to the<br />
opposite corner of the rectangle. While dragg<strong>in</strong>g, a dashed rectangle is drawn. When the rectangle has the correct<br />
size, release the mouse button. The zoom<strong>in</strong>g function will f<strong>in</strong>ish and the software offset and ga<strong>in</strong> of both channels and<br />
the record view offset and ga<strong>in</strong> are adjusted to the values that result <strong>in</strong> view<strong>in</strong>g the selected part of the screen.<br />
Perform<strong>in</strong>g cursor measurements<br />
To perform measurements on the measured data, two pairs of cursors are available. Each cursor pair exists of a horizontal<br />
and a vertical cursor that can be placed anywhere <strong>in</strong>side or outside the signal display. Where the two cursors<br />
cross each other, a l<strong>in</strong>k is made. For the left cursor this l<strong>in</strong>k is p<strong>in</strong>k, for the right cursor this l<strong>in</strong>k is black.<br />
Switch<strong>in</strong>g on cursors<br />
To switch on cursors, enter the Cursors menu and select the Large cursors item or the Small cursors item. Large cursors<br />
are drawn from the left to the right hand side of the signal display or from the top to the bottom of the signal display.<br />
Small cursors only form a small cross. The Cursors menu can be found <strong>in</strong> the ma<strong>in</strong> menu or can be called by<br />
click<strong>in</strong>g the right mouse button <strong>in</strong> the signal display. When the cursors are switched on, a special cursor readout w<strong>in</strong>dow<br />
appears as well.<br />
The cursors are waveform based. This means that the cursor position is related to the waveform. If the record view<br />
offset or record view ga<strong>in</strong> is changed, the cursor position will rema<strong>in</strong> at the same position <strong>in</strong> the waveform. If the<br />
<strong>in</strong>put sensitivity, the software offset or software ga<strong>in</strong> is changed, the cursor will stay at the same voltage level.<br />
Because of this, cursors can get off screen. In the record view scroll bar two red l<strong>in</strong>es are drawn to <strong>in</strong>dicate the position<br />
of the cursors <strong>in</strong> the record.<br />
To position a cursor, br<strong>in</strong>g the mouse po<strong>in</strong>ter on the cursor to position. The mouse po<strong>in</strong>ter will change shape:<br />
position a horizontal cursor<br />
position a vertical cursor<br />
position a cursor pair<br />
H<strong>in</strong>t: To position an off screen cursor, br<strong>in</strong>g the mouse po<strong>in</strong>ter to the edge of the signal display at which the cursor<br />
exceeds. The mouse po<strong>in</strong>ter will change shape.<br />
Now press the left mouse button and drag the cursor to the correct position. When that is reached, release the left<br />
mouse button. The orig<strong>in</strong>al mouse po<strong>in</strong>ter shape is restored.<br />
Sett<strong>in</strong>g up the cursor measurements<br />
With the cursors it is possible to measure the <strong>in</strong>put signal(s) <strong>in</strong> several ways. To set up the cursor measurements,<br />
press the sett<strong>in</strong>gs button at the cursor readout w<strong>in</strong>dow (the right most button at the left top of the w<strong>in</strong>dow caption) A<br />
menu appears, conta<strong>in</strong><strong>in</strong>g the follow<strong>in</strong>g options. The menu can also be called by press<strong>in</strong>g the right mouse button over<br />
the table.<br />
Voltmeter measurements<br />
All measurements which can be selected <strong>in</strong> the voltmeter measurements submenu are also available <strong>in</strong> the voltmeter.<br />
The only difference between the measurements is that the voltmeter uses the previous two measurement values and<br />
The <strong>Oscilloscope</strong><br />
42
<strong>DI</strong>-<strong>770</strong> and WINDAQ/Scope Manual<br />
the current measured values which are added together and meaned before the value is displayed. For a complete<br />
description of the measurements, see the chapter on the voltmeter.<br />
Time<br />
Rise time left: the rise time of the signal at the position of the left cursor is determ<strong>in</strong>ed. The rise time is determ<strong>in</strong>ed<br />
by f<strong>in</strong>d<strong>in</strong>g the closest zero cross<strong>in</strong>g ((max + m<strong>in</strong>) / 2) relative to the cursor position. Next the 10% and 90% values are<br />
calculated. Now, the 10% and 90% po<strong>in</strong>ts are searched left and right of the zero cross<strong>in</strong>g po<strong>in</strong>t. By us<strong>in</strong>g the number<br />
of samples between the 10% and 90% po<strong>in</strong>ts, the rise time is calculated.<br />
Rise time right: the rise time at the position of the right cursor is determ<strong>in</strong>ed.<br />
Sample time left: us<strong>in</strong>g the left cursor position, the time on which the selected sample is taken will be displayed.<br />
Sample time right: us<strong>in</strong>g the right cursor position, the time on which the selected sample is taken will be displayed.<br />
Sample time difference: the difference between the right and the left cursor sample time is determ<strong>in</strong>ed.<br />
Cursor frequency: us<strong>in</strong>g the number of samples between the left and the right cursor, the frequency is calculated. The<br />
calculation is d<strong>one</strong> us<strong>in</strong>g the follow<strong>in</strong>g formula: (number of samples between cursors / total number of samples) *<br />
sample frequency. To determ<strong>in</strong>e a correct frequency always select <strong>one</strong> period or multiply the frequency by the number<br />
of selected periods for greater precision.<br />
Voltage<br />
Voltage left: the voltage of the left cursor will be displayed.<br />
Voltage right: the voltage of the right cursor will be displayed.<br />
Voltage difference: the difference between the voltage of the left and the voltage of the right cursor is calculated.<br />
Select<strong>in</strong>g the m<strong>in</strong> and max of the signal, the top-top value is calculated.<br />
Slew rate<br />
Slew rate left: the slew rate of the signal at the position of the left cursor is determ<strong>in</strong>ed. The slew rate is the voltage<br />
level which a signal drops or ga<strong>in</strong>s per millisecond.<br />
Slew rate right: the slew rate of the signal at the position of the right cursor is determ<strong>in</strong>ed.<br />
Phase difference<br />
These measurements are only available when both channels are switched on. They measure the phase angle difference<br />
between the signals on channel 1 and channel 2. When the software can not detect a complete period of the signal<br />
on both channels or when the frequency of the two signals are different, no phase difference is determ<strong>in</strong>ed.<br />
Degrees: The angle is presented <strong>in</strong> degrees<br />
Radials: The angle is presented <strong>in</strong> radials<br />
cos(): The cos<strong>in</strong>e value of the angle is presented<br />
Set impedance value<br />
The dBm and power measurements require a reference resistance. The value of the resistance can be set us<strong>in</strong>g this<br />
menu item. The value has to be entered <strong>in</strong> Ohm and is default 600.<br />
Automatic correct po<strong>in</strong>ts<br />
By select<strong>in</strong>g this option, the automatic correction of the cursors to the nearest zero cross<strong>in</strong>g is enabled or disabled.<br />
The right cursor is positi<strong>one</strong>d <strong>one</strong> or more periods from the left cursor. To determ<strong>in</strong>e a frequency or duty cycle, position<br />
the right cursor at the end of the second period or further for correct results.<br />
Automatic track<strong>in</strong>g cursors<br />
If this option is enabled, the voltage levels of the cursors are automatically set to the voltage levels of the sample<br />
numbers which correspond to the left and right cursor.<br />
Calculate values<br />
If this option is disabled, no new calculations will be d<strong>one</strong> until the option is enabled.<br />
Show measurement name<br />
The <strong>Oscilloscope</strong><br />
43
<strong>DI</strong>-<strong>770</strong> and WINDAQ/Scope Manual<br />
Show measured value<br />
Show measurement unit<br />
To reduce the space used by the w<strong>in</strong>dow on the screen, the measurement name, value and/or unit can be hidden. This<br />
results <strong>in</strong> the disappearance of the correspond<strong>in</strong>g column which results <strong>in</strong> a smaller w<strong>in</strong>dow.<br />
Display font<br />
By select<strong>in</strong>g this option, the font which is used to display the str<strong>in</strong>gs and values can be changed. The font sett<strong>in</strong>gs<br />
which can be changed are: font name, font style, font size and the font color.<br />
Background color<br />
By select<strong>in</strong>g this option, the background color can be altered. Some font colors (e.g. light green) are not show<strong>in</strong>g up<br />
very good on a white background. Change the background color to e.g. black for a better result.<br />
Select<strong>in</strong>g the active channel<br />
The cursors can only calculate values for <strong>one</strong> channel.<br />
The buttons <strong>in</strong> the left top of the w<strong>in</strong>dow caption bar can be used to select the channel from which data is used to calculate<br />
the selected measurements.<br />
There are two ways to change between channels, press<strong>in</strong>g the buttons with the mouse or by us<strong>in</strong>g the correspond<strong>in</strong>g<br />
number on the keyboard.<br />
Show<strong>in</strong>g or hid<strong>in</strong>g the cursor readout<br />
The left button of the two <strong>in</strong> the right top corner of the w<strong>in</strong>dow caption bar can be used to hide (<br />
) or show<br />
( ) the grid with measured data. When hid<strong>in</strong>g the data, the height of the w<strong>in</strong>dow equals the height of the w<strong>in</strong>dow<br />
caption bar.<br />
Switch<strong>in</strong>g off cursors<br />
To switch off cursors, enter the Cursors menu and select the No cursors item. The Cursors menu can be found <strong>in</strong> the<br />
ma<strong>in</strong> menu or can be called by click<strong>in</strong>g the right mouse button <strong>in</strong> the signal display.<br />
When the cursors are switched off, the cursor readout w<strong>in</strong>dow disappear as well.<br />
The cursors can also be switched off by click<strong>in</strong>g the close button (<br />
) <strong>in</strong> the cursor readout w<strong>in</strong>dow.<br />
The <strong>Oscilloscope</strong><br />
44
<strong>DI</strong>-<strong>770</strong> and WINDAQ/Scope Manual<br />
7. The Voltmeter<br />
If from the <strong>in</strong>put signals only the size is important and not the time <strong>in</strong>formation or frequency comp<strong>one</strong>nts, a voltmeter<br />
is a suitable <strong>in</strong>strument to measure with. The software is equipped with a two channel digital voltmeter. The voltmeter<br />
functions as follows:<br />
• A measurement is performed (m<strong>in</strong>imal 200 samples).<br />
• The measured data is processed, e.g. for calculat<strong>in</strong>g the RMS value or the mean value. Eleven different operations<br />
are available.<br />
• The calculated values are displayed, e.g. add CH1 and CH2 and display on channel <strong>one</strong>. Sixteen different display<br />
methods are available.<br />
For each channel the voltmeter has up to three displays to present the measured and calculated values. The value displayed<br />
<strong>in</strong> a display is fully configurable. Also for each display a bar graph is available, to give a quick overview of<br />
the signal size <strong>in</strong> relation to the <strong>in</strong>put range.<br />
Of all four <strong><strong>in</strong>struments</strong>, the voltmeter has the lowest sett<strong>in</strong>gs priority. This means that if for example the oscilloscope<br />
is active, the record length, pre samples and post samples of the oscilloscope are used <strong>in</strong> the voltmeter. The voltmeter<br />
only uses post samples to perform the calculations. If less than 200 post samples are available, no calculations are<br />
d<strong>one</strong> and a message is displayed. The only sett<strong>in</strong>g that can be changed by the voltmeter when the oscilloscope or<br />
spectrum analyzer is active, is the sample frequency.<br />
The measure system of the voltmeter<br />
The voltmeter takes 200 samples of the <strong>in</strong>put signal with a certa<strong>in</strong> sample frequency. These 200 samples are used to<br />
perform several calculations.<br />
The Voltmeter<br />
45
<strong>DI</strong>-<strong>770</strong> and WINDAQ/Scope Manual<br />
The voltmeter has a limited frequency range <strong>in</strong> which the measurements are performed correctly. If the periodical<br />
time of the <strong>in</strong>put signal is much larger than the measur<strong>in</strong>g time, a wrong value is measured. See the next illustration.<br />
If the time <strong>in</strong> which the 200 samples are taken is too long <strong>in</strong> relation to the periodical time of the <strong>in</strong>put signal, alias<strong>in</strong>g<br />
can occur (see also the chapter about the oscilloscope).<br />
Sett<strong>in</strong>g the frequency range<br />
To avoid errors like the <strong>one</strong>s menti<strong>one</strong>d above, the frequency range of the voltmeter has to be set properly. The sampl<strong>in</strong>g<br />
frequency is then changed. By activat<strong>in</strong>g the choice Frequency range from the Sett<strong>in</strong>gs menu, a popup menu<br />
appears, <strong>in</strong> which several frequencies are available. The frequencies <strong>in</strong>dicate the center frequency of a frequency<br />
range <strong>in</strong> which the voltmeter measures properly. The size of the frequency range is determ<strong>in</strong>ed from 0.2 x f center to 5<br />
x f center .<br />
When Auto freq. is chosen, the voltmeter determ<strong>in</strong>es the best frequency sett<strong>in</strong>g by itself. For each measurement the<br />
frequency has to be determ<strong>in</strong>ed, result<strong>in</strong>g <strong>in</strong> a longer time before updat<strong>in</strong>g the displays.<br />
Note: The Auto frequency sett<strong>in</strong>g overrides the sample frequency sett<strong>in</strong>g <strong>in</strong> the oscilloscope and the spectrum analyzer.<br />
This will result <strong>in</strong> a less usable display <strong>in</strong> those <strong><strong>in</strong>struments</strong>.<br />
To avoid this, the choice Scope freq. is available <strong>in</strong> the menu. The voltmeter will use the same sample frequency as<br />
the oscilloscope or spectrum analyzer.<br />
Display<strong>in</strong>g channels<br />
The voltmeter has several modes to display the two channels. To select the measure mode, enter the Sett<strong>in</strong>gs menu<br />
and select Channels. Use the Measure channel option to enable or disable measur<strong>in</strong>g from a channel. Measur<strong>in</strong>g takes<br />
place from at least <strong>one</strong> channel.<br />
When only <strong>one</strong> channel is measured, the controls of the other channel are disabled or removed from the display.<br />
Sett<strong>in</strong>g up a channel<br />
The channels of the voltmeter can be setup <strong>in</strong> several ways. Both channels have the same sett<strong>in</strong>gs, so only channel 1<br />
is discussed here.<br />
Sett<strong>in</strong>g the <strong>in</strong>put range<br />
In the voltmeter, the <strong>in</strong>put range or sensitivity can be set through the channels sett<strong>in</strong>gs dialog.<br />
The channels sett<strong>in</strong>g dialog is called by select<strong>in</strong>g the Channels option from the Sett<strong>in</strong>gs menu. In this dialog, the <strong>in</strong>put<br />
sensitivities are available, as well as an autorang<strong>in</strong>g sett<strong>in</strong>g.<br />
The Voltmeter<br />
46
<strong>DI</strong>-<strong>770</strong> and WINDAQ/Scope Manual<br />
To switch on Autorang<strong>in</strong>g for the Voltmeter, a special button is available. When auto rang<strong>in</strong>g is switched on, the button<br />
caption is Auto, otherwise it holds the current set <strong>in</strong>put sensitivity. Press<strong>in</strong>g the right mouse button on this button<br />
will br<strong>in</strong>g up a menu with all sensitivities.<br />
When the <strong>in</strong>put signal is larger than the selected <strong>in</strong>put range, '-------' is displayed.<br />
Note: When Autorang<strong>in</strong>g is switched on, several measurements might be needed to set the <strong>in</strong>put sensitivity properly,<br />
depend<strong>in</strong>g on the <strong>in</strong>put signal.<br />
Another way to set the sensitivity is by us<strong>in</strong>g the keyboard. A few keys have been reserved for sett<strong>in</strong>g the <strong>in</strong>put sensitivity<br />
of the channels. These keys are:<br />
<br />
<br />
<br />
<br />
Increase Ch1 sensitivity<br />
Decrease Ch1 sensitivity<br />
Increase Ch2 sensitivity<br />
Decrease Ch2 sensitivity<br />
Sett<strong>in</strong>g the <strong>in</strong>put coupl<strong>in</strong>g<br />
The <strong>in</strong>put signal can be coupled directly to the ADC (DC) or through a capacitor to the ADC (AC). In the hardware, a<br />
capacitor is switched <strong>in</strong>to (AC) or out of (DC) the signal path.<br />
In COUPLING DC the complete signal (AC+DC) at the <strong>in</strong>put is passed through. In COUPLING AC only the AC<br />
comp<strong>one</strong>nt of the <strong>in</strong>put signal is passed through. It is then possible to exam<strong>in</strong>e e.g. a ±20 mV ripple on a 30 V DC<br />
voltage, s<strong>in</strong>ce only the ripple is passed through and the DC voltage not. AC voltages with a frequency lower than ±4<br />
Hz are not coupled correctly.<br />
There are three different ways to set the coupl<strong>in</strong>g. Two ways are: by click<strong>in</strong>g the coupl<strong>in</strong>g button or by press<strong>in</strong>g keys.<br />
The third way is through the channel sett<strong>in</strong>gs dialog. The channels sett<strong>in</strong>g dialog is called by select<strong>in</strong>g the Channels<br />
option from the Sett<strong>in</strong>gs menu. In this dialog, the signal coupl<strong>in</strong>g sett<strong>in</strong>g is available.<br />
In the tool bar for each channel a coupl<strong>in</strong>g button is found, the coupl<strong>in</strong>g button for Ch1 at the left hand side of the<br />
screen, for Ch2 at the right hand side of the screen. The picture at the button <strong>in</strong>dicates the state of the coupl<strong>in</strong>g sett<strong>in</strong>g.<br />
The left button of the two buttons below is <strong>in</strong>dicat<strong>in</strong>g AC coupl<strong>in</strong>g, the right button is <strong>in</strong>dicat<strong>in</strong>g DC coupl<strong>in</strong>g.<br />
The current coupl<strong>in</strong>g state is displayed <strong>in</strong> the coupl<strong>in</strong>g button.<br />
The keys which can be used to change the signal coupl<strong>in</strong>g are:<br />
<br />
<br />
<br />
<br />
sets the coupl<strong>in</strong>g of channel 1 to AC<br />
sets the coupl<strong>in</strong>g of channel 1 to DC<br />
sets the coupl<strong>in</strong>g of channel 2 to AC<br />
sets the coupl<strong>in</strong>g of channel 2 to DC<br />
Sett<strong>in</strong>g a DC hardware offset<br />
The signal offset is adjustable <strong>in</strong> two ways: a hardware method and a (per display) software method.<br />
Us<strong>in</strong>g the hardware method, an adjustable DC voltage is added before sampl<strong>in</strong>g the <strong>in</strong>put signal. The hardware<br />
method can be realized by select<strong>in</strong>g the Channels option from the Sett<strong>in</strong>gs menu. Type the offset <strong>in</strong> the DC hardware<br />
offset edit box. This voltage will be added to the <strong>in</strong>put signal. If a voltage has to be subtracted, enter a negative value.<br />
The Voltmeter<br />
47
<strong>DI</strong>-<strong>770</strong> and WINDAQ/Scope Manual<br />
Configur<strong>in</strong>g the displays<br />
The voltmeter can display the measured values <strong>in</strong> several different ways, <strong>in</strong> up to six displays. Below the display, a<br />
bargraph is show<strong>in</strong>g the value <strong>in</strong> the display <strong>in</strong> a graphic format.<br />
By activat<strong>in</strong>g the choice Displays from the Sett<strong>in</strong>gs menu, a dialog appears <strong>in</strong> which the sett<strong>in</strong>gs of all the displays<br />
can be changed. This method works always, even if the display and bargraph for which the sett<strong>in</strong>gs are changed are<br />
<strong>in</strong>visible.<br />
These sett<strong>in</strong>gs can also be d<strong>one</strong> by plac<strong>in</strong>g the mouse cursor over a display and press<strong>in</strong>g the right mouse button. A<br />
popup menu appears with all sett<strong>in</strong>gs for that display. This method only works if the display or bargraph is visible.<br />
All sett<strong>in</strong>gs applied to a display are also applied to the correspond<strong>in</strong>g bargraph.<br />
The follow<strong>in</strong>g explanations expect that the Display sett<strong>in</strong>gs dialog is displayed and active.<br />
Switch<strong>in</strong>g displays on and off<br />
A display can be made visible by plac<strong>in</strong>g a checkmark <strong>in</strong> front of the Show display str<strong>in</strong>g. If a display is turned on,<br />
while the match<strong>in</strong>g channel is not measured, the display will not be showed.<br />
If all six displays are visible, the layout is as follow<strong>in</strong>g:<br />
- The left hand side displays belong to channel 1.<br />
- The right hand side displays belong to channel 2.<br />
Switch<strong>in</strong>g bargraphs on and off<br />
Each display has a bargraph that can be switched on or off <strong>in</strong>dependently from the displays. The bargraphs can be<br />
switched on or off by tagg<strong>in</strong>g or untagg<strong>in</strong>g the Show bargraph option.<br />
The Voltmeter<br />
48
<strong>DI</strong>-<strong>770</strong> and WINDAQ/Scope Manual<br />
Process<strong>in</strong>g the measured value<br />
The software can process the measured value <strong>in</strong> 11 different ways. By activat<strong>in</strong>g the Measurement selector, the follow<strong>in</strong>g<br />
calculations can be set:<br />
TRUE RMS:<br />
Peak-peak:<br />
Mean:<br />
Max:<br />
M<strong>in</strong>:<br />
dBm:<br />
Power:<br />
The true RMS value of the <strong>in</strong>put signal is calculated. The true RMS value (Root Mean Square)<br />
is the value of a random voltage, correspond<strong>in</strong>g to a DC voltage, dissipat<strong>in</strong>g the same power <strong>in</strong><br />
a resistance <strong>in</strong> the same amount of time. So an AC voltage of 1 volt RMS corresponds to a DC<br />
voltage of 1 volt. (Most -cheap- voltmeters only display, when measur<strong>in</strong>g AC voltage, the correct<br />
value when the <strong>in</strong>put signal is a true s<strong>in</strong>e wave and usually <strong>in</strong> a limited frequency range.<br />
This <strong>in</strong>strument always displays the correct value.)<br />
The peak-peak value of the <strong>in</strong>put signal is determ<strong>in</strong>ed. The peak-peak value of a DC voltage is<br />
zero. The peak-peak value of a true s<strong>in</strong>e wave with a RMS value of 1 volt is 2.828 volt.<br />
The mean value of the <strong>in</strong>put signal is determ<strong>in</strong>ed. The mean value of a vary<strong>in</strong>g voltage corresponds<br />
with the value of a DC voltage across the same load. The mean value of a 1 volt DC<br />
voltage is 1 volt. The mean value of a true s<strong>in</strong>e wave AC voltage is 0.<br />
The maximum of the <strong>in</strong>put signal is determ<strong>in</strong>ed. The maximum value of a 1 volt DC voltage is<br />
1 volt. The maximum value of a 1 volt AC s<strong>in</strong>e wave voltage is 1.414 volt. This is determ<strong>in</strong>ed<br />
from the 200 samples.<br />
The m<strong>in</strong>imum of the <strong>in</strong>put signal is determ<strong>in</strong>ed. The m<strong>in</strong>imum value of a 1 volt DC voltage is<br />
1 volt. The m<strong>in</strong>imum value of a 1 volt AC s<strong>in</strong>e wave is -1.414 volt. Determ<strong>in</strong>ed from the 200<br />
samples.<br />
The value of the <strong>in</strong>put signal is converted to dB. This is d<strong>one</strong> us<strong>in</strong>g the formula:<br />
dBm = 10 ×<br />
1000 × value 2<br />
log----------------------------------------------<br />
reference resistance<br />
'value' is the RMS value of the <strong>in</strong>put signal. The reference resistance can be set us<strong>in</strong>g the edit<br />
box set impedance value.<br />
The value of the <strong>in</strong>put signal is converted to a power, us<strong>in</strong>g the formula:<br />
POWER<br />
=<br />
value 2<br />
----------------------------------------------<br />
reference resistance<br />
'value' is the RMS value of the <strong>in</strong>put signal. The reference resistance can be set us<strong>in</strong>g the edit<br />
box Set impedance value.<br />
Crest:<br />
Frequency:<br />
Duty cycle:<br />
The value of the <strong>in</strong>put signal is converted to a crest factor, us<strong>in</strong>g the formula:<br />
CREST = ---------------------------------<br />
peak value<br />
RMS – Value<br />
'peak value' is the highest voltage of the <strong>in</strong>put signal with respect to the zero level.<br />
The frequency of the <strong>in</strong>put signal is determ<strong>in</strong>ed. Frequencies lower than 0.5 Hz, are displayed<br />
as 0 Hz. The frequency can be determ<strong>in</strong>ed for <strong>one</strong> channel at a time. If the frequency is determ<strong>in</strong>ed<br />
for channel 1, the frequency of channel 2 can't be determ<strong>in</strong>ed.<br />
The duty cycle of the <strong>in</strong>put signal is determ<strong>in</strong>ed. The duty cycle <strong>in</strong>dicates how much of a signal<br />
is low/high (depend<strong>in</strong>g on the duty cycle sett<strong>in</strong>g) <strong>in</strong> relation to the periodic time of the signal.<br />
The number is given <strong>in</strong> percent.<br />
The Voltmeter<br />
49
<strong>DI</strong>-<strong>770</strong> and WINDAQ/Scope Manual<br />
Moment. value:<br />
Displays the voltage level of the first post sample.<br />
Note: If a frequency or duty cycle measurement is set, the voltmeter is slower on all displays, because for determ<strong>in</strong>ation<br />
of the frequency or duty cycle more measurements have to be d<strong>one</strong>.<br />
Display<strong>in</strong>g the calculated value<br />
For display<strong>in</strong>g the measured and calculated values, 16 methods are available. Activate the Display measured value<br />
selector to set the follow<strong>in</strong>g possibilities:<br />
CH1:<br />
CH2:<br />
CH1*CH2:<br />
CH1/CH2:<br />
CH2/CH1:<br />
CH1-CH2:<br />
CH2-CH1:<br />
CH1+CH2:<br />
The measured value of Ch1 is displayed.<br />
The measured value of Ch2 is displayed.<br />
The values of Ch1 and Ch2 are multiplied and the result is displayed.<br />
The value of Ch1 is divided by the value of Ch2. The result is displayed.<br />
The value of Ch2 is divided by the value of Ch1. The result is displayed.<br />
The value of Ch2 is subtracted from the value of Ch1. The result is displayed.<br />
The value of Ch1 is subtracted from the value of Ch2. The result is displayed.<br />
The values of Ch1 and Ch2 are added and the sum is displayed.<br />
> than HI: The value is compared to the high value. If the value is higher than the high value, then PASS is<br />
displayed, else LO is displayed.<br />
< than LO: The value is compared to the low value. If the value is lower than the low value, then PASS is displayed,<br />
else HI is displayed.<br />
>< COMP: The value is compared to the high value and the low value. If the value is higher than the high<br />
value, HI is displayed. If the value is lower than the low value, LO is displayed. If the value is<br />
lower than or equal to the high value and higher than or equal to the low value, PASS is displayed.<br />
HI LO: The value is compared to the high value and the low value. If the measured value is higher than the<br />
high value, PASS is displayed. If the value is lower than the low value, PASS is displayed. If the<br />
value is lower than or equal to the high value and higher than or equal to the low value, FAIL is<br />
displayed.<br />
The Voltmeter<br />
50
<strong>DI</strong>-<strong>770</strong> and WINDAQ/Scope Manual<br />
MAX:<br />
MIN:<br />
The maximum measured value ever is displayed.<br />
The m<strong>in</strong>imum measured value ever is displayed.<br />
LOG(1/2):<br />
LOG(2/1):<br />
The result of the calculation<br />
is displayed.<br />
The result of the calculation<br />
is displayed.<br />
20 ×<br />
log<br />
measured<br />
------------------------------------------------<br />
valueCH1<br />
measured valueCH2<br />
20 × log<br />
measured<br />
------------------------------------------------<br />
valueCH2<br />
measured valueCH1<br />
Change the units of measure<br />
Normally, every type of measurement has its own unit. The voltmeter allows you to change this unit for each display<br />
separately. There are twelve predef<strong>in</strong>ed values and a user def<strong>in</strong>ed value.<br />
The selection can be made with the Units of measure pulldown. The unit which is selected, is displayed <strong>in</strong> the display.<br />
To select a user def<strong>in</strong>ed unit of measure, just type a str<strong>in</strong>g with a maximum length of <strong>five</strong> characters.<br />
Change the units per measurement unit<br />
Us<strong>in</strong>g the edit box Units per measurement unit, the number of units per selected unit can be set. In the edit box, the<br />
multiplication factor can be entered. The measured value is multiplied by the factor and displayed.<br />
This can be used if e.g. a 1:10 probe is used. To correct the read<strong>in</strong>g, enter a value 10 <strong>in</strong> the edit box.<br />
Relative measurements<br />
The voltmeter can take absolute measurements and relative measurements. When measur<strong>in</strong>g absolute, the measurements<br />
are related to the 0 level (ground). When measur<strong>in</strong>g relative, the measurements are related to a settable value.<br />
This value is subtracted from the measured value by the software. This means that before display<strong>in</strong>g the value <strong>in</strong> the<br />
display, the relative value is subtracted from the calculated value.<br />
The Voltmeter<br />
51
<strong>DI</strong>-<strong>770</strong> and WINDAQ/Scope Manual<br />
The value can be set by enter<strong>in</strong>g a value <strong>in</strong> the Set relative value edit box. The value has to be entered <strong>in</strong> volts.<br />
To enable relative measurements, a checkmark has to be placed after Relative measur<strong>in</strong>g. Relative measur<strong>in</strong>g is then<br />
enabled.<br />
Relative measurements can be used with e.g. a temperature measurement. Suppose the output voltage of a temperature<br />
probe at 0 degrees Celsius equals +10 volt. By enter<strong>in</strong>g a relative value of 10 volt, the absolute temperature is<br />
directly readable.<br />
Comparison measurements<br />
For display<strong>in</strong>g the measured and calculated values, 16 methods are available (See: display<strong>in</strong>g the measured value).<br />
Four of those methods are comparison measurements:<br />
> than HI<br />
< than LO<br />
>< COMP<br />
LO HI<br />
These measurements require a high and a low value. By enter<strong>in</strong>g a value <strong>in</strong> the Set high value or Set low value edit<br />
boxes, the high and low levels can be set.<br />
Note: For easy enter<strong>in</strong>g of low and high values, the software does not check whether the high value is larger than the<br />
low value. So it is possible to enter a low value which is larger than the high value. Measurements us<strong>in</strong>g these values<br />
will give useless results.<br />
Sett<strong>in</strong>g the reference impedance<br />
The dBm and power measurements require a reference resistance. The value of the resistance can be set us<strong>in</strong>g the Set<br />
impedance value edit box. The value has to be entered <strong>in</strong> Ohm. The default value is 600.<br />
Sett<strong>in</strong>g the number of digits after the decimal separator<br />
With every calculation d<strong>one</strong> on a measurement, a default number of digits after the separator is set (auto sett<strong>in</strong>g). This<br />
number corresponds with the significant number of figures determ<strong>in</strong>ed by the hardware. The number of digits after<br />
the separator can be changed us<strong>in</strong>g the Number precision selector.<br />
Note: The displays have a maximum number of 6 digits. When the value <strong>in</strong> the display is that large that digits before<br />
the decimal separator can't be displayed, an arrow po<strong>in</strong>t<strong>in</strong>g to the left is displayed left from the first digit. The displayed<br />
digits are correct though.<br />
Sound sett<strong>in</strong>gs<br />
With comparison measurements, for each value a sound signal can be set. When this is d<strong>one</strong>, the set limits are <strong>in</strong>dicated<br />
audibly.<br />
By activat<strong>in</strong>g the choice Sounds from the Sett<strong>in</strong>gs menu, a dialog appears from which for each display value a sound<br />
signal can be set. For each display value can be chosen from: No sound, 100 Hz, 200 Hz, 500 Hz, 1 kHz, 2 kHz, 5<br />
kHz and 10 kHz.<br />
With the choice No sound, no sound signal is generated with the selected display value.<br />
If you are us<strong>in</strong>g the PC speaker or a WAV device, it is only possible to make <strong>one</strong> sound at a time. This means that the<br />
sound which is played first, is repeated until the condition is <strong>in</strong>valid. As soon as the condition is <strong>in</strong>valid, the sound for<br />
the next condition can be played.<br />
Note: If your computer is equipped with a digital playback soundcard (a soundcard which can play WAV files), you<br />
can also play the sounds through your soundcard. Select the sound device pull down after which you can select wav<br />
device from the list. If this option is miss<strong>in</strong>g and you have a soundcard, you should <strong>in</strong>stall drivers for the soundcard<br />
or you don’t have a digital playback soundcard.<br />
The Voltmeter<br />
52
<strong>DI</strong>-<strong>770</strong> and WINDAQ/Scope Manual<br />
Note: If the computer is equipped with a soundcard, it is also possible to select the MI<strong>DI</strong> device option. The MI<strong>DI</strong><br />
device uses the <strong>in</strong>strument sett<strong>in</strong>gs as def<strong>in</strong>ed <strong>in</strong> the General MI<strong>DI</strong> standard. When us<strong>in</strong>g MI<strong>DI</strong>, it is possible to play<br />
all four sounds (LO, HI, FAIL and PASS) at <strong>one</strong> time.<br />
Resett<strong>in</strong>g the m<strong>in</strong>imum and maximum values<br />
When display<strong>in</strong>g the measured values, the maximum value ever and/or the m<strong>in</strong>imum value ever can be displayed.<br />
These values are kept until the software is closed.<br />
To reset the m<strong>in</strong>imum and maximum values, for each channel a reset button is available <strong>in</strong> the speedbar (<br />
) and<br />
through the sett<strong>in</strong>gs, channel menu. By press<strong>in</strong>g this button, the maximum value is set to the lowest possible measured<br />
value. The m<strong>in</strong>imum value is set to the maximum measured value possible.<br />
Perform<strong>in</strong>g measurements<br />
H<strong>in</strong>t: Use the frequency meter to determ<strong>in</strong>e the frequency of the <strong>in</strong>put signal.<br />
When the device voltmeter is switched on, and the measurement process is not <strong>in</strong> <strong>one</strong> shot mode, measurements take<br />
place. The measured values are displayed cont<strong>in</strong>uously. If the oscilloscope is active, the trigger conditions also apply<br />
to the voltmeter.<br />
Start and stop measur<strong>in</strong>g<br />
The measur<strong>in</strong>g can be halted by press<strong>in</strong>g the pause button ( ) or key. The <strong>one</strong>shot button ( ) next to the<br />
pause button becomes available ( key), and the pause button changes to a play button ( ).<br />
The measur<strong>in</strong>g can also be halted by select<strong>in</strong>g the Stop cont<strong>in</strong>uous measur<strong>in</strong>g option from the Measure menu. The<br />
option Perform a s<strong>in</strong>gle measurement becomes available and the Stop cont<strong>in</strong>uous measur<strong>in</strong>g option changes to Start<br />
cont<strong>in</strong>uous measur<strong>in</strong>g.<br />
Averag<strong>in</strong>g<br />
Normally the voltmeter adds the two previous measured values with the current measured value and divides it by<br />
three. In this way, very small changes do not show up which results <strong>in</strong> a more stable values.<br />
To switch averag<strong>in</strong>g on or off, enter the Sett<strong>in</strong>gs menu and select the Mean values option. The check mark <strong>in</strong> front of<br />
the menu item <strong>in</strong>dicates whether averag<strong>in</strong>g is on or off.<br />
Fast measur<strong>in</strong>g<br />
By select<strong>in</strong>g the option Fast measur<strong>in</strong>g from the Sett<strong>in</strong>gs menu, fast measur<strong>in</strong>g is enabled or disabled. Before the fast<br />
measur<strong>in</strong>g option can be enabled, you have to set a frequency range other than scope or auto.<br />
When enabl<strong>in</strong>g the fast measur<strong>in</strong>g option, the trigger timeout is set to zero, the record length and post samples are set<br />
to 200 and the averag<strong>in</strong>g is disabled.<br />
One shot measurements<br />
A s<strong>in</strong>gle measurement can be performed by press<strong>in</strong>g the <strong>one</strong>shot button or by select<strong>in</strong>g the Perform s<strong>in</strong>gle measurement<br />
option from the measure menu.<br />
Note: One measurement consists of three successive measurements (except if fast measur<strong>in</strong>g is selected or mean values<br />
is disabled, these take <strong>one</strong> measurement), from which the measured values are averaged. Between the measurements<br />
the display is updated. If the voltmeter has to perform an autorang<strong>in</strong>g action or has to change the sample<br />
frequency dur<strong>in</strong>g an <strong>one</strong>shot, measurements are taken until all changes to the range and the frequency have been<br />
d<strong>one</strong>. Then three measurements are taken with the f<strong>in</strong>al sett<strong>in</strong>gs.<br />
The Voltmeter<br />
53
<strong>DI</strong>-<strong>770</strong> and WINDAQ/Scope Manual<br />
Cont<strong>in</strong>uous measur<strong>in</strong>g can be switched on by activat<strong>in</strong>g the play button or press<strong>in</strong>g the key.<br />
Stor<strong>in</strong>g measurement values on disk or paper<br />
The voltmeter can store measurements on disk or pr<strong>in</strong>t them. This is d<strong>one</strong> <strong>in</strong> a completely different way than the other<br />
<strong><strong>in</strong>struments</strong>.<br />
The voltmeter can be set to measure (acquire) at fixed times. The measured value will then be stored on disk or sent<br />
to the pr<strong>in</strong>ter.<br />
The time at which measurements are taken is not 100% guaranteed. The reason for this is the W<strong>in</strong>dows environment<br />
which is not a real-time multitask<strong>in</strong>g system. Because of this there is no guarantee that the time between two measurements<br />
is the set <strong>in</strong>terval. If this occurs, close all w<strong>in</strong>dows programs except the voltmeter and then try aga<strong>in</strong>.<br />
Sett<strong>in</strong>g the time between two measurements<br />
By activat<strong>in</strong>g the choice Time from the Acquisition menu, the time between two measurements can be set. A dialog<br />
box appears <strong>in</strong> which the time <strong>in</strong> seconds can be entered.<br />
Note: When a time shorter than 0.5 seconds is entered, the acquisition speed is determ<strong>in</strong>ed by the changes of the displays.<br />
Sett<strong>in</strong>g the hysteresis<br />
With an acquisition time smaller than 0.5 seconds, the acquisition speed is determ<strong>in</strong>ed by the changes <strong>in</strong> the displays.<br />
It can occur that the <strong>in</strong>put signal has a value just between two displayable values. In that case the display will constantly<br />
change between the two values. To avoid a constant storage to disk or pr<strong>in</strong>ter <strong>in</strong> that case, a hysteresis can be<br />
set. Only when the <strong>in</strong>put value change exceeds the hysteresis value, the <strong>in</strong>put value will be stored.<br />
By activat<strong>in</strong>g the item Hysteresis from the Acquisition menu, a dialog appears <strong>in</strong> which the hysteresis can be entered.<br />
The hysteresis is entered as a percentage of the last measured value. With each new measurement, the size of the hysteresis<br />
<strong>in</strong> volts is recalculated.<br />
The hysteresis can only be set with an acquisition time smaller than 0.5 seconds.<br />
Start an acquisition<br />
By activat<strong>in</strong>g the choice Write data from the Acquire menu, a menu is shown with which a selection can be made to<br />
write to disk or pr<strong>in</strong>ter.<br />
The choice Disk will cause the measurement data to be stored on disk. After activat<strong>in</strong>g the choice, a save dialog<br />
appears <strong>in</strong> which the drive, directory and name of the file can be typed. If the typed file already exists, an overwrite<br />
prompt will appear. The measur<strong>in</strong>g will start after this. At fixed times a measurement is taken and stored on disk.<br />
Measur<strong>in</strong>g can be aborted by press<strong>in</strong>g the cancel button.<br />
The choice Pr<strong>in</strong>ter will cause the measurement data to be written to the pr<strong>in</strong>ter. After activat<strong>in</strong>g the choice, a pr<strong>in</strong>t dialog<br />
appears from which a pr<strong>in</strong>ter can be selected. A dialog will appear <strong>in</strong> which the title of the job can be typed. Now<br />
measur<strong>in</strong>g starts. At fixed times a measurement is taken and sent to the pr<strong>in</strong>ter. Measur<strong>in</strong>g can be aborted by press<strong>in</strong>g<br />
the Cancel button.<br />
The pr<strong>in</strong>t<strong>in</strong>g and writ<strong>in</strong>g can also be activated by press<strong>in</strong>g the follow<strong>in</strong>g buttons on the speedbar:<br />
In both modes, the measurement values are preceded by a block of <strong>in</strong>formation. In that block is <strong>in</strong>dicated how the<br />
channels are set and how the high, low and relative levels are set. Each measurement is preceded by the time and date<br />
of the measurement.<br />
If a measured value is larger than the selected <strong>in</strong>put range, '-------' is displayed. This will also be stored on disk or sent<br />
to the pr<strong>in</strong>ter. The date/time format can be set through the program sett<strong>in</strong>gs dialog.<br />
The Voltmeter<br />
54
<strong>DI</strong>-<strong>770</strong> and WINDAQ/Scope Manual<br />
8. The Data Logger<br />
For measur<strong>in</strong>g slowly chang<strong>in</strong>g signals (e.g. the temperature change <strong>in</strong> a room) the data logger is the most suitable<br />
<strong>in</strong>strument.<br />
The data logger is a two channel, direct register<strong>in</strong>g measur<strong>in</strong>g <strong>in</strong>strument, display<strong>in</strong>g the changes of the <strong>in</strong>put signal<br />
graphically on the screen or on paper.<br />
The data logger measures at settable, fixed times and processes the measured value if necessary. The number of measurements<br />
to be taken is also settable.<br />
Note: The data logger displays each measured sample immediately, the oscilloscope first takes all samples and then<br />
displays the complete record.<br />
The data logger measures the <strong>in</strong>put signals at adjustable times. The time between two measurements is adjustable<br />
from 0.01 second to 500 seconds. The number of samples is also adjustable from 1 to 32760. The maximum measur<strong>in</strong>g<br />
time is 500 sec x 32760 samples = 16380000 seconds (189.6 days).<br />
Note: Due to the different way of measur<strong>in</strong>g the <strong>in</strong>put signals, the data logger can not be used together with the<br />
oscilloscope, voltmeter or spectrum analyzer.<br />
The data logger measur<strong>in</strong>g system<br />
Before measur<strong>in</strong>g with the data logger, the channels and the time base have to be set up completely.<br />
When all sett<strong>in</strong>gs (<strong>in</strong>put sensitivity, coupl<strong>in</strong>g, number of samples, sample speed etc.) are made, the data logger can be<br />
started. All sett<strong>in</strong>gs will be applied to the hardware and the hardware beg<strong>in</strong>s to measure. The hardware will cont<strong>in</strong>ue<br />
measur<strong>in</strong>g until the predef<strong>in</strong>ed number of samples is measured or when the user <strong>in</strong>terrupts the measurement. Each<br />
measured sample will be stored <strong>in</strong> the board memory of the hardware.<br />
The Data Logger<br />
55
<strong>DI</strong>-<strong>770</strong> and WINDAQ/Scope Manual<br />
When the measurement is runn<strong>in</strong>g, the software will constantly monitor whether a new sample is measured. If a new<br />
sample is measured, it is obta<strong>in</strong>ed from the hardware acquisition memory and displayed on the display. This will cont<strong>in</strong>ue<br />
until the measurement is ready.<br />
Note: At certa<strong>in</strong> sample speeds and/or relatively slow computers, it might occur that the software can't keep up with<br />
the hardware, <strong>in</strong> other words, the software misses samples the hardware has measured and stored. This is only a<br />
m<strong>in</strong>or problem. The software detects that it has missed samples and will warn the user by light<strong>in</strong>g up a red LED <strong>in</strong> the<br />
display and display<strong>in</strong>g a warn<strong>in</strong>g message <strong>in</strong> the h<strong>in</strong>t bar.<br />
Note: The missed sample <strong>in</strong> the record is filled with the value of the previous sample.<br />
Note: Try<strong>in</strong>g to reload the missed sample(s) would take so much time, that aga<strong>in</strong> samples would be missed.<br />
When the total measurement is ready, the software will reload the complete measured record from the hardware<br />
acquisition memory and display it.<br />
H<strong>in</strong>t: There are a few th<strong>in</strong>gs to make the software keep up with the hardware longer:<br />
- make the data logger w<strong>in</strong>dow as small as possible<br />
- Select Scan mode <strong>in</strong>stead of Roll mode<br />
- Do not show references while measur<strong>in</strong>g<br />
- close all other applications (especially applications <strong>in</strong> DOS w<strong>in</strong>dows)<br />
- Set the W<strong>in</strong>dows video driver to display up to 256 colors <strong>in</strong>stead of True color or High color<br />
Display<strong>in</strong>g channels<br />
The two channels can be measured <strong>in</strong> several different ways:<br />
Ch1<br />
Ch2<br />
Ch1 and Ch2<br />
only channel 1 is measured and displayed<br />
only channel 2 is measured and displayed<br />
channel 1 and channel 2 are measured and displayed simultaneously<br />
Select<strong>in</strong>g which way to measure the channels can be d<strong>one</strong> us<strong>in</strong>g the Measure menu.<br />
When only <strong>one</strong> channel is measured, the controls of the other channel are disabled or removed from the display.<br />
Sett<strong>in</strong>g up a channel<br />
Sett<strong>in</strong>g up a channel <strong>in</strong> the data logger is d<strong>one</strong> <strong>in</strong> the same way as <strong>in</strong> the oscilloscope. The only difference is that <strong>in</strong><br />
the data logger no auto rang<strong>in</strong>g for the <strong>in</strong>put sensitivity is available.<br />
For <strong>in</strong>formation on sett<strong>in</strong>g up a channel, see chapter 2, the oscilloscope.<br />
Sett<strong>in</strong>g up the time axis<br />
The time base <strong>in</strong> the data logger is almost the same as <strong>in</strong> the oscilloscope. However, the data logger has no pre trigger<br />
sett<strong>in</strong>g.<br />
Therefor only the items that differ from the oscilloscope time base sett<strong>in</strong>gs are discussed here.<br />
Sett<strong>in</strong>g up the sample speed<br />
The data logger measures a number of samples with a certa<strong>in</strong> time between two samples. This results <strong>in</strong> a total measure<br />
time of (number of samples x time between two samples).<br />
To setup the tim<strong>in</strong>g characteristics of the data logger measurement, open the data logger measurement speed dialog.<br />
The dialog can be opened by activat<strong>in</strong>g the choice Sampl<strong>in</strong>g speed... from the Time base menu.<br />
In the upper part of the dialog a selection has to be made how the tim<strong>in</strong>g characteristics of the data logger measurement<br />
have to be set. There are three possible ways:<br />
The Data Logger<br />
56
<strong>DI</strong>-<strong>770</strong> and WINDAQ/Scope Manual<br />
• Enter the number of samples and the time between to measurements. The total measur<strong>in</strong>g time is determ<strong>in</strong>ed by<br />
the dialog.<br />
• Enter the number of samples and the total measur<strong>in</strong>g time. The time between two samples is determ<strong>in</strong>ed by the<br />
dialog.<br />
• Enter the time between two samples and the total measur<strong>in</strong>g time. The number of samples is determ<strong>in</strong>ed by the<br />
dialog.<br />
When a selection is made, the selected items can be entered <strong>in</strong> the <strong>in</strong>put boxes <strong>in</strong> the lower part of the dialog. Under<br />
the <strong>in</strong>put boxes, the determ<strong>in</strong>ed value of the third parameter is displayed. When an <strong>in</strong>valid comb<strong>in</strong>ation is made, the<br />
text <strong>in</strong> the <strong>in</strong>put box that causes the <strong>in</strong>valid comb<strong>in</strong>ation turns <strong>in</strong>to red. When this is ignored, the value is clipped to<br />
the nearest valid value.<br />
When the parameters are set properly the OK button can be clicked to apply the values and return to the data logger.<br />
Note: The tim<strong>in</strong>g <strong>in</strong> the hardware is generated by a crystal oscillator and two programmable <strong>in</strong>teger dividers. This<br />
system can't generate all frequencies, but comes close. When the OK button is clicked, the software will determ<strong>in</strong>e the<br />
division values for both dividers, <strong>in</strong> such a way that the generated frequency approaches the requested frequency as<br />
close as possible. A lot of divider comb<strong>in</strong>ations have to be checked for that. While determ<strong>in</strong><strong>in</strong>g the correct division<br />
factors, an hour glass is displayed<br />
Sett<strong>in</strong>g the record length<br />
The data logger takes a number of samples to display the <strong>in</strong>put signal. This number of samples is called the Record<br />
length. To change the record length, three ways are available: us<strong>in</strong>g the record length menu, us<strong>in</strong>g the sample speed<br />
dialog or by means of function keys.<br />
To change the record length us<strong>in</strong>g the menu, enter the Time base menu and select the Record length item. Another<br />
menu will pop up, conta<strong>in</strong><strong>in</strong>g the available record lengths and an item for a user def<strong>in</strong>ed record length. Select<strong>in</strong>g this<br />
item will br<strong>in</strong>g up a dialog box <strong>in</strong> which a self def<strong>in</strong>ed record length (with<strong>in</strong> the <strong>in</strong>strument hardware limits) can be<br />
entered. The Time base menu can also be entered by press<strong>in</strong>g the right mouse button over <strong>one</strong> of the time base controls<br />
or read outs.<br />
For chang<strong>in</strong>g the record length the follow<strong>in</strong>g function keys are available:<br />
<br />
<br />
Select a shorter record length<br />
Select a longer record length<br />
For the third way to change the record length, see sett<strong>in</strong>g up the sampl<strong>in</strong>g speed.<br />
Sett<strong>in</strong>g the horizontal axis type<br />
The data logger can measure for a very long time. In that case it can be useful to have real time and date values along<br />
the time axis <strong>in</strong>stead of the number of seconds s<strong>in</strong>ce the start<strong>in</strong>g moment.<br />
This can be selected by open<strong>in</strong>g the Sett<strong>in</strong>gs menu and select the Horizontal axis type item. Now you can select<br />
between Date / Time and Sample times.<br />
Perform measurements<br />
Before measur<strong>in</strong>g with the data logger, the channels and the time base have to be set up completely.<br />
The channels do not have auto rang<strong>in</strong>g, so the sensitivity has to be set manually. S<strong>in</strong>ce the data logger usually measures<br />
slow signals, the <strong>in</strong>put coupl<strong>in</strong>g should be set to DC, otherwise the <strong>in</strong>put capacitor will block the signal.<br />
Start measur<strong>in</strong>g<br />
When all sett<strong>in</strong>gs are made, the data logger can be started. This can be d<strong>one</strong> <strong>in</strong> three ways:<br />
The Data Logger<br />
57
<strong>DI</strong>-<strong>770</strong> and WINDAQ/Scope Manual<br />
• Click<strong>in</strong>g the Play button ( ).<br />
• Press<strong>in</strong>g the key<br />
• Enter the Measure menu and select the Start measur<strong>in</strong>g item<br />
When the measurement is started, all controls except the Stop controls are disabled.<br />
Stop measur<strong>in</strong>g<br />
When the predef<strong>in</strong>ed number of samples is reached, the data logger will stop measur<strong>in</strong>g. It is also possible to stop the<br />
data logger manually, e.g. when the event to measure is measured, or the <strong>in</strong>strument sett<strong>in</strong>gs are wrong (coupl<strong>in</strong>g,<br />
sensitivity etc.). This can be d<strong>one</strong> <strong>in</strong> three ways:<br />
• Click<strong>in</strong>g the Stop button ( )<br />
• Press<strong>in</strong>g the key<br />
• Enter the Measure menu and select the Stop measur<strong>in</strong>g item<br />
When the measurement is stopped, all controls are enabled aga<strong>in</strong>.<br />
Scroll mode<br />
While measur<strong>in</strong>g, the data logger displays the measured signal on a 1:1 base, mean<strong>in</strong>g that for each sample 1 display<br />
pixel is used. When the number of measured samples is larger than the available number of pixels <strong>in</strong> the display, the<br />
record view offset has to be changed <strong>in</strong> such a way that the latest samples will be visible.<br />
There are two ways to do this:<br />
Scan mode: When the display is full, the record view offset will change a full screen, so the new samples will start<br />
fill<strong>in</strong>g the display from the left hand side of the display aga<strong>in</strong>.<br />
Roll mode: When the display is full, the record view offset will change with <strong>one</strong> sample, mak<strong>in</strong>g space for <strong>one</strong> new<br />
sample. Each new sample causes a change <strong>in</strong> the record view offset.<br />
Roll mode looks nicer than Scan mode, but is also slower, so the data logger will so<strong>one</strong>r miss samples <strong>in</strong> Roll mode<br />
than <strong>in</strong> Scan mode.<br />
To set the scroll mode, enter the Measure menu, select the item Scroll mode and choose between the two possibilities.<br />
Compar<strong>in</strong>g signals us<strong>in</strong>g the reference channels<br />
To make the data logger keep up with the measur<strong>in</strong>g hardware longer, references can be switched off while measur<strong>in</strong>g.<br />
To do this, open the References menu and select the Show references while measur<strong>in</strong>g item.<br />
When the item Show references while measur<strong>in</strong>g is checked, switched on references are shown while the data logger<br />
measures. If the item is not checked, the references are switched off when the measurement is started and switched on<br />
aga<strong>in</strong> when the data logger is ready.<br />
Perform<strong>in</strong>g cursor measurements<br />
Like <strong>in</strong> the oscilloscope, the data logger has a set of cursors to perform measurements on the displayed signals.<br />
The cursors <strong>in</strong> the data logger work exactly like the oscilloscope, so refer to chapter 2, the oscilloscope, for an explanation<br />
on how to work with the cursors.<br />
The Data Logger<br />
58
<strong>DI</strong>-<strong>770</strong> and WINDAQ/Scope Manual<br />
9. The Spectrum Analyzer<br />
The common way to exam<strong>in</strong>e electrical signals is <strong>in</strong> the time doma<strong>in</strong>, us<strong>in</strong>g an oscilloscope. The time doma<strong>in</strong> is used<br />
to determ<strong>in</strong>e amplitude, time and phase <strong>in</strong>formation, which is necessary to describe the behavior of an electrical system.<br />
Not all electrical systems can be characterized <strong>in</strong> the time doma<strong>in</strong>. Circuits like filters, amplifiers, oscillators, mixers,<br />
modulators and detectors can be characterized best by their frequency behavior. That frequency behavior is best<br />
obta<strong>in</strong>ed by observ<strong>in</strong>g the electrical signals <strong>in</strong> the frequency doma<strong>in</strong>. To display the frequency doma<strong>in</strong>, an <strong>in</strong>strument<br />
is needed that can dist<strong>in</strong>guish different frequencies from each other and measure the signal size at the different frequencies.<br />
An <strong>in</strong>strument that can display the frequency doma<strong>in</strong> is the spectrum analyzer. It graphically displays voltage<br />
as a function of frequency.<br />
In the time doma<strong>in</strong> all frequency comp<strong>one</strong>nts of a signal are seen summed together. In the frequency doma<strong>in</strong>, complex<br />
signals (signals composed of more than <strong>one</strong> frequency) are separated <strong>in</strong>to their frequency comp<strong>one</strong>nts, where the<br />
voltage of each comp<strong>one</strong>nt is displayed.<br />
The frequency doma<strong>in</strong> conta<strong>in</strong>s <strong>in</strong>formation which is not available <strong>in</strong> the time doma<strong>in</strong>. Therefore the spectrum analyzer<br />
has certa<strong>in</strong> advantages compared with an oscilloscope.<br />
• With a spectrum analyzer small harmonic distortions on a signal can be displayed better than on an oscilloscope.<br />
A s<strong>in</strong>e wave may look good <strong>in</strong> the time doma<strong>in</strong>, however <strong>in</strong> the frequency doma<strong>in</strong> the harmonic distortion is visible.<br />
• A noise signal may look fully random <strong>in</strong> the time doma<strong>in</strong>, <strong>in</strong> the frequency doma<strong>in</strong> it can appear that <strong>one</strong> frequency<br />
is dom<strong>in</strong>antly present.<br />
The Spectrum Analyzer<br />
59
<strong>DI</strong>-<strong>770</strong> and WINDAQ/Scope Manual<br />
• In the frequency doma<strong>in</strong> it is very simple to determ<strong>in</strong>e carrier frequency, modulation frequency, modulation level<br />
and modulation distortion from a modulated signal (AM or FM).<br />
Description of FFT<br />
The spectrum analyzer is us<strong>in</strong>g the Fast Fourier Transform (FFT) pr<strong>in</strong>ciple. For this transform, a number of samples<br />
are taken with a previously set sample speed. The number of samples has to be a power of 2, e.g. 512, 1024 or 2048.<br />
With these samples, here called FFT-block, the spectrum is calculated. Therefore the FFT places an <strong>in</strong>f<strong>in</strong>ite number of<br />
FFT-blocks beh<strong>in</strong>d each other, <strong>in</strong> the positive and negative direction. Each FFT-block forms 1 period of the created<br />
periodic signal.<br />
From the signal obta<strong>in</strong>ed like this, the spectrum is calculated. The FFT calculation results <strong>in</strong> a number of spectral<br />
comp<strong>one</strong>nts which is half the number of samples <strong>in</strong> the FFT block (e.g. 256, 512, 1024). These spectral comp<strong>one</strong>nts<br />
together form the frequency spectrum of the <strong>in</strong>put signal.<br />
The spectrum analyzer displays an amplitude spectrum, which means that a 2 volt peak-peak s<strong>in</strong>e wave is displayed<br />
with a 1 volt spectral comp<strong>one</strong>nt.<br />
Alias<strong>in</strong>g<br />
Like the oscilloscope, the spectrum analyzer needs a high enough sampl<strong>in</strong>g frequency to avoid alias<strong>in</strong>g. The result of<br />
alias<strong>in</strong>g when us<strong>in</strong>g FFT is that the frequency curve is folded back on itself.<br />
The Spectrum Analyzer<br />
60
<strong>DI</strong>-<strong>770</strong> and WINDAQ/Scope Manual<br />
The orig<strong>in</strong>al signal is sampled at a sample time t. The critical frequency (Nyquist frequency) is (1/2t) Hz.<br />
W<strong>in</strong>dow<strong>in</strong>g<br />
FFT treats the FFT-block like it is <strong>one</strong> period of a periodic signal. If the sampled signal is not periodic, harmonic distortion<br />
can arise, s<strong>in</strong>ce the periodic waveform, 'created by the FFT', can have sharp discont<strong>in</strong>uities. See also the follow<strong>in</strong>g<br />
illustration. These discont<strong>in</strong>uities are also called calculation errors.<br />
This means that because of the calculation errors extra frequency comp<strong>one</strong>nts are generated around the true frequency.<br />
Because of this 'smear<strong>in</strong>g' the amplitude of the true frequency decreases, s<strong>in</strong>ce the area under the curve<br />
rema<strong>in</strong>s the same.<br />
The smear<strong>in</strong>g, caused by the calculation errors, can be decreased by plac<strong>in</strong>g a w<strong>in</strong>dow on the FFT-block samples, <strong>in</strong><br />
such a way that the ends of the FFT-block are smoothly tapered to zero and discont<strong>in</strong>uities do not occur when the FFT<br />
treats the w<strong>in</strong>dowed block as <strong>one</strong> period of a periodic signal. Each sample of the FFT-block is therefore multiplied by<br />
a factor, whose size is dependent on the position of the sample <strong>in</strong> the FFT-block.<br />
The software supports six different w<strong>in</strong>dows:<br />
rectangular (all data is not changed)<br />
Hann<strong>in</strong>g (s<strong>in</strong>usoidal)<br />
Hamm<strong>in</strong>g (s<strong>in</strong>usoidal)<br />
Bartlett (s<strong>in</strong>usoidal)<br />
Blackman (triangular)<br />
Parzen (triangular)<br />
Display<strong>in</strong>g channels<br />
The spectrum analyzer has several modes to display the two channels. To select the measure mode, enter the Measure<br />
menu and select:<br />
Ch1 measure and display only channel 1<br />
Ch2 measure and display only channel 2<br />
Ch1 and Ch2<br />
measure channel 1 and channel 2 simultaneously and display the values of both channels<br />
When only <strong>one</strong> channel is measured, the controls of the other channel are disabled or removed from the display.<br />
The Spectrum Analyzer<br />
61
<strong>DI</strong>-<strong>770</strong> and WINDAQ/Scope Manual<br />
Sett<strong>in</strong>g up a channel<br />
The two channels of the spectrum analyzer are completely configurable. Both channels are identical, each has its own<br />
menu item <strong>in</strong> the ma<strong>in</strong> menu. The possibilities of the vertical axes <strong>in</strong> the spectrum analyzer are the same as <strong>in</strong> the<br />
oscilloscope, so only the differences are discussed here. S<strong>in</strong>ce the possibilities for both channels are equal, channel 1<br />
is expla<strong>in</strong>ed here.<br />
Sett<strong>in</strong>g the <strong>in</strong>put sensitivity<br />
The <strong>in</strong>put sensitivity of a channel determ<strong>in</strong>es how large a certa<strong>in</strong> signal will be displayed, the lower the full scale<br />
value, the larger the signal will be displayed. It is possible to enable an autorang<strong>in</strong>g function.<br />
Note: The vertical axis <strong>in</strong> the spectrum analyzer has a range that is twice the <strong>in</strong>put sensitivity. This is d<strong>one</strong> because<br />
the frequency comp<strong>one</strong>nts of which a signal is built, can have a larger amplitude than the <strong>in</strong>put sensitivity. So if an<br />
<strong>in</strong>put sensitivity of 8 Volt full scale is selected, the axis will have values from 0 to 16 Volt full scale.<br />
The sensitivity can be set through the Sensitivity menu. The Sensitivity menu is called by enabl<strong>in</strong>g the Ch1 menu and<br />
then select<strong>in</strong>g the Sensitivity menu. In this menu the <strong>in</strong>put sensitivities are available. In the spectrum analyzer also an<br />
Autorang<strong>in</strong>g sett<strong>in</strong>g is available. The Sensitivity menu can also be entered by click<strong>in</strong>g the right mouse button over<br />
<strong>one</strong> of the Ch1 or Ch2 controls and readouts.<br />
To switch on Autorang<strong>in</strong>g, a special button is available. When autorang<strong>in</strong>g is switched on, the button caption is Auto,<br />
otherwise it holds the current set <strong>in</strong>put sensitivity. Press<strong>in</strong>g the right mouse button on this button will br<strong>in</strong>g up a menu<br />
with all sensitivities.<br />
Note: When Autorang<strong>in</strong>g is switched on, several measurements might be needed to set the <strong>in</strong>put sensitivity properly,<br />
depend<strong>in</strong>g on the <strong>in</strong>put signal.<br />
Another way to set the sensitivity is by us<strong>in</strong>g the keyboard. A few keys have been reserved for sett<strong>in</strong>g the <strong>in</strong>put sensitivity<br />
of the channels. These keys are:<br />
<br />
<br />
<br />
<br />
Increase Ch1 sensitivity<br />
Decrease Ch1 sensitivity<br />
Increase Ch2 sensitivity<br />
Decrease Ch2 sensitivity<br />
Logarithmic or l<strong>in</strong>ear vertical axis<br />
The vertical axis of the spectrum analyzer can be set to l<strong>in</strong>ear or to logarithmic.<br />
When set to l<strong>in</strong>ear, the normal axis is used, runn<strong>in</strong>g from 0 to 2 x Sensitivity. When set to logarithmic, the position on<br />
the l<strong>in</strong>ear axis that is mark-ed Sensitivity will get the value<br />
Value = 20 x 10 log Sensitivity<br />
The rest of the labels will get a value that is related to this value and differ from it with 10 dB per division (when Software<br />
ga<strong>in</strong> is set to 1). The measured data will be transformed to logarithmic data as well.<br />
Select<strong>in</strong>g the axis type can be d<strong>one</strong> by enter<strong>in</strong>g the Ch1 menu, choos<strong>in</strong>g the Axis type menu and select<strong>in</strong>g the axis<br />
type.<br />
The axis type can also be set by the keyboard us<strong>in</strong>g the follow<strong>in</strong>g keys:<br />
<br />
<br />
toggle the Ch1 axis between L<strong>in</strong>ear and Logarithmic<br />
toggle the Ch2 axis between L<strong>in</strong>ear and Logarithmic<br />
The Spectrum Analyzer<br />
62
<strong>DI</strong>-<strong>770</strong> and WINDAQ/Scope Manual<br />
Note: Due to 'smear<strong>in</strong>g' errors, caused by discont<strong>in</strong>uities (See W<strong>in</strong>dow<strong>in</strong>g) and (with<strong>in</strong> specifications) distortion <strong>in</strong><br />
the Analog to Digital Converter non-exist<strong>in</strong>g frequency comp<strong>one</strong>nts will show up when a logarithmic axis is selected.<br />
These comp<strong>one</strong>nts are all outside the dynamic range of the measurement system.<br />
To avoid confusion with these non-exist<strong>in</strong>g frequency comp<strong>one</strong>nts, the logarithmic graph can be clipped on the theoretical<br />
dynamic range of the measurement system. This is d<strong>one</strong> by select<strong>in</strong>g the Vertical log axis range item from the<br />
Sett<strong>in</strong>gs menu and choos<strong>in</strong>g either Not clipped or Clipped conform hardware specs.<br />
Sett<strong>in</strong>g up the frequency range<br />
Along the horizontal axis of the screen, the frequency of the measured spectrum is projected.<br />
Magnify<strong>in</strong>g the frequency axis and horizontally position<strong>in</strong>g the signal is d<strong>one</strong> <strong>in</strong> the same way as <strong>in</strong> the oscilloscope<br />
and is therefor not discussed here.<br />
Sett<strong>in</strong>g up the frequency axis type<br />
The frequency axis can be set up <strong>in</strong> four different modes:<br />
L<strong>in</strong>ear<br />
Logarithmic<br />
Octaves<br />
the frequency axis runs from 0 to the maximum frequency and has a l<strong>in</strong>ear division.<br />
the frequency axis runs from the m<strong>in</strong>imum frequency to the maximum frequency and has a logarithmic<br />
division.<br />
the frequency axis runs from 22.1 Hz to 22.6 kHz and is divided <strong>in</strong> 10 octaves. The center frequencies,<br />
the lower limits and the higher limits of the octaves are:<br />
f center f lo f hi<br />
31.25 Hz 22.1 Hz 44.2 Hz<br />
62.5 Hz 44.2 Hz 88.4 Hz<br />
125 Hz 88.4 Hz 176.8 Hz<br />
250 Hz 176.8 Hz 353.5 Hz<br />
500 Hz 353.5 Hz 707.1 Hz<br />
1 kHz 707.1 Hz 1.414 kHz<br />
2 kHz 1.414 kHz 2.828 kHz<br />
4 kHz 2.828 kHz 5.656 kHz<br />
8 kHz 5.656 kHz 11.314 kHz<br />
16 kHz 11.314 kHz 22.627 kHz<br />
Each octave is displayed with the same width on the display.<br />
This mode requires that the sampl<strong>in</strong>g frequency is about 44 kHz and the record length is at least<br />
1024 spectral comp<strong>one</strong>nts. When this display mode is switched on, the sampl<strong>in</strong>g frequency can<br />
no longer be set and the record length can only be set to a few lengths.<br />
Third octaves<br />
the frequency axis runs from 17.54 Hz to 22.6 kHz and is divided <strong>in</strong> 31 thirds of octaves. The<br />
center frequencies, the lower limits and the higher limits of the octaves are:<br />
f center f lo f hi<br />
19.68 Hz 17.54 Hz 22.09 Hz<br />
The Spectrum Analyzer<br />
63
<strong>DI</strong>-<strong>770</strong> and WINDAQ/Scope Manual<br />
24.80 Hz 22.09 Hz 17.84 Hz<br />
31.25 Hz 27.84 Hz 35.1 Hz<br />
39.4 Hz 35.1 Hz 44.2 Hz<br />
49.6 Hz 44.2 Hz 55.7 Hz<br />
62.5 Hz 55.7 Hz 70.2 Hz<br />
78.7 Hz 70.2 Hz 88.4 Hz<br />
99.2 Hz 88.4 Hz 111 Hz<br />
125 Hz 111 Hz 140 Hz<br />
157 Hz 140 Hz 177 Hz<br />
198 Hz 177 Hz 223 Hz<br />
250 Hz 223 Hz 280 Hz<br />
315 Hz 280 Hz 354 Hz<br />
397 Hz 354 Hz 445 Hz<br />
500 Hz 445 Hz 561 Hz<br />
630 Hz 561 Hz 707 Hz<br />
794 Hz 707 Hz 891 Hz<br />
1.00 kHz 891 Hz 1.12 kHz<br />
1.26 kHz 1.12 kHz 1.41 kHz<br />
1.59 kHz 1.41 kHz 1.78 kHz<br />
2.00 kHz 1.78 kHz 2.24 kHz<br />
2.52 kHz 2.24 kHz 2.82 kHz<br />
3.17 kHz 2.82 kHz 3.56 kHz<br />
4.00 kHz 3.56 kHz 4.49 kHz<br />
5.04 kHz 4.49 kHz 5.66 kHz<br />
6.35 kHz 5.66 kHz 7.13 kHz<br />
8.00 kHz 7.13 kHz 8.98 kHz<br />
10.1 kHz 8.98 kHz 11.3 kHz<br />
12.7 kHz 11.3 kHz 14.3 kHz<br />
16.0 kHz 14.3 kHz 17.9 kHz<br />
20.2 kHz 17.9 kHz 22.6 kHz<br />
The Spectrum Analyzer<br />
64
<strong>DI</strong>-<strong>770</strong> and WINDAQ/Scope Manual<br />
Each third octave is displayed with the same width on the display.<br />
This mode requires that the sampl<strong>in</strong>g frequency is about 44 kHz and the record length is at least<br />
4096 spectral comp<strong>one</strong>nts. When this display mode is switched on, the sampl<strong>in</strong>g frequency and<br />
the record length can no longer be set.<br />
Note: When the spectrum analyzer is set to Hold and the frequency axis is set to octaves or third octaves, the signal<br />
will not match with the axis and the grid until a new measurement is taken.<br />
Sett<strong>in</strong>g the frequency range<br />
The frequency range can be set <strong>in</strong> two ways: us<strong>in</strong>g the menu of by means of special function keys.<br />
The frequency range is determ<strong>in</strong>ed fully on the sample frequency: the frequency range is half of the sample frequency.<br />
To change the Frequency range us<strong>in</strong>g the menu, enter the Frequency axis menu and select the Frequency range item.<br />
A new menu will appear with all possible frequency range sett<strong>in</strong>gs. The Frequency axis menu can also be entered by<br />
press<strong>in</strong>g the right mouse button over <strong>one</strong> of the frequency axis controls or read outs.<br />
The last item <strong>in</strong> the menu is a user def<strong>in</strong>ed sett<strong>in</strong>g. Activat<strong>in</strong>g this item will br<strong>in</strong>g up a dialog box <strong>in</strong> which a self<br />
def<strong>in</strong>ed frequency range (with<strong>in</strong> the <strong>in</strong>strument hardware limitations) can be entered. Due to the way the sample frequency<br />
is generated <strong>in</strong> the hardware, not all frequencies and thus not all frequency ranges can be generated. If an<br />
<strong>in</strong>valid frequency range is entered, the closest valid frequency range will be generated.<br />
The follow<strong>in</strong>g keys can be used to change the frequency range:<br />
<br />
<br />
Set the frequency range <strong>one</strong> step smaller<br />
Set the frequency range <strong>one</strong> step larger<br />
Sett<strong>in</strong>g the spectrum record length<br />
The spectrum analyzer takes a number of samples to determ<strong>in</strong>e the frequency spectrum of the <strong>in</strong>put signal. This number<br />
has to be a power of 2. After the FFT calculation, a spectrum with half of that number spectral comp<strong>one</strong>nts is<br />
obta<strong>in</strong>ed. This number of spectral comp<strong>one</strong>nts is called the Record length.<br />
To change the record length, two ways are available: by means of a menu or by means of function keys.<br />
To change the record length us<strong>in</strong>g the menu, enter the Frequency axis menu and select the Record length item.<br />
Another menu will pop up, conta<strong>in</strong><strong>in</strong>g the available record lengths. The Frequency axis menu can also be entered by<br />
press<strong>in</strong>g the right mouse button over <strong>one</strong> of the frequency axis controls or read outs.<br />
For chang<strong>in</strong>g the record length the follow<strong>in</strong>g function keys are available:<br />
<br />
<br />
Select a shorter record length<br />
Select a longer record length<br />
Note: Calculat<strong>in</strong>g a spectrum is time consum<strong>in</strong>g. The time need for calculat<strong>in</strong>g a spectrum is strongly dependent on<br />
the calculat<strong>in</strong>g power of the computer and of the selected record length.<br />
Sett<strong>in</strong>g up the FFT<br />
FFT w<strong>in</strong>dow function<br />
To reduce 'smear<strong>in</strong>g' errors (See W<strong>in</strong>dow<strong>in</strong>g), a w<strong>in</strong>dow<strong>in</strong>g function can be selected.<br />
The Spectrum Analyzer<br />
65
<strong>DI</strong>-<strong>770</strong> and WINDAQ/Scope Manual<br />
To select a w<strong>in</strong>dow<strong>in</strong>g function, press the W<strong>in</strong>dow button ( ) or select the item FFT w<strong>in</strong>dow function... from<br />
the Sett<strong>in</strong>gs menu. A dialog will appear <strong>in</strong> which the requested w<strong>in</strong>dow can be selected. A graphic display will show<br />
effect of the w<strong>in</strong>dow<strong>in</strong>g function on the sampled signal.<br />
The available w<strong>in</strong>dow types are:<br />
rectangular (all data is not changed)<br />
Hann<strong>in</strong>g (s<strong>in</strong>usoidal)<br />
Hamm<strong>in</strong>g (s<strong>in</strong>usoidal)<br />
Bartlett (s<strong>in</strong>usoidal)<br />
Blackman (triangular)<br />
Parzen (triangular)<br />
Perform<strong>in</strong>g measurements<br />
When all sett<strong>in</strong>gs are made, measurements can be made.<br />
Start and stop measur<strong>in</strong>g<br />
To avoid a new screen of measurement data replac<strong>in</strong>g an old screen, measur<strong>in</strong>g an display<strong>in</strong>g of data can be stopped.<br />
This can be d<strong>one</strong> <strong>in</strong> several ways: by press<strong>in</strong>g the Pause button (<br />
), by press<strong>in</strong>g the key of by activat<strong>in</strong>g the<br />
item Stop cont<strong>in</strong>uous measur<strong>in</strong>g from the Measure menu.<br />
When measur<strong>in</strong>g is stopped, the latest measured data will rema<strong>in</strong> on the screen. The Pause button changes to a Play<br />
button ( ) and the One shot button ( ) becomes available.<br />
The measured signal can now be exam<strong>in</strong>ed.<br />
S<strong>in</strong>gle measurements<br />
To perform a s<strong>in</strong>gle measurement, press the One shot button, press the key of activate the Perform a s<strong>in</strong>gle measurement<br />
item from the Measure menu. When <strong>in</strong> the Spectrum analyzer averag<strong>in</strong>g is selected, there will be performed<br />
as many measurements as there are set for the averag<strong>in</strong>g and then measur<strong>in</strong>g will stop.<br />
Cont<strong>in</strong>uous measur<strong>in</strong>g can be started aga<strong>in</strong> by press<strong>in</strong>g the Play button, the key or the item Start cont<strong>in</strong>uous measur<strong>in</strong>g<br />
from the Measure menu. The One shot button will be disabled aga<strong>in</strong>.<br />
Averag<strong>in</strong>g<br />
When a noisy signal is measured, the <strong>in</strong>fluence of the noise can be elim<strong>in</strong>ated by averag<strong>in</strong>g several spectra. The noise<br />
comp<strong>one</strong>nt(s) will disappear and the actual signal rema<strong>in</strong>s.<br />
Averag<strong>in</strong>g can be switched on by select<strong>in</strong>g the item Perform averag<strong>in</strong>g of from the Measure menu. In the next menu a<br />
number of measurements can be selected that have to be averaged. The item 1 measurement will switch off averag<strong>in</strong>g.<br />
When averag<strong>in</strong>g is set to e.g. 20 measurements and the spectrum analyzer is set to Pause, press<strong>in</strong>g the One shot button<br />
will result <strong>in</strong> tak<strong>in</strong>g 20 measurements which are averaged<br />
Measur<strong>in</strong>g maximum values<br />
The spectrum analyzer can be set to measure and display only the maximum values of the spectral comp<strong>one</strong>nts. After<br />
a number of measurements the highest value of each spectral comp<strong>one</strong>nt is displayed then.<br />
To enable measur<strong>in</strong>g maximum values, enter the Measure menu and select the choice Measure max values. A check<br />
mark <strong>in</strong> front of the menu item <strong>in</strong>dicates whether measur<strong>in</strong>g maximum values is switched on or off.<br />
The Spectrum Analyzer<br />
66
<strong>DI</strong>-<strong>770</strong> and WINDAQ/Scope Manual<br />
Note: The display of maximum values is reset when the <strong>in</strong>strument sett<strong>in</strong>g changes<br />
H<strong>in</strong>t: This mode can be useful when the frequency response characteristic of a device needs to be determ<strong>in</strong>ed. Apply<br />
a frequency sweeped signal and switch on Measure max values and the characteristic will be created.<br />
Measure the Total Harmonic Distortion of a signal<br />
With the spectrum analyzer it is possible to measure the Total Harmonic Distortion of a signal.<br />
The THD is def<strong>in</strong>ed as:<br />
where V 1 is the RMS amplitude of the base frequency of the <strong>in</strong>put signal, V 2 .. V n are the RMS amplitudes of each<br />
higher harmonic.<br />
To measure the THD, enter the Measure menu and select the Total Harmonic Distortion item or by press<strong>in</strong>g the THD<br />
button (<br />
2 2 2 2 2 2 2 2 2<br />
10 V<br />
20<br />
2 + V 3 + V 4 + V 5 + V 6 + V 7 + V 8 + V 9 + .. + V<br />
× log--------------------------------------------------------------------------------------------------------------------------------------------------- n<br />
V 1<br />
). The software will determ<strong>in</strong>e the base frequency of the signal by assum<strong>in</strong>g that the spectral<br />
comp<strong>one</strong>nt with the largest amplitude is the base frequency. Then the amplitudes of all higher harmonics (up to 100)<br />
<strong>in</strong> the measured record are determ<strong>in</strong>ed and the THD is determ<strong>in</strong>ed.<br />
In the THD output w<strong>in</strong>dow the base frequency of the signal is given, the harmonic distortion <strong>in</strong> dB is given and a<br />
table with the amplitudes of all used harmonics is given. This is d<strong>one</strong> for all active channels.<br />
The number of harmonics that is used for the calculation depends on the base frequency. If the base frequency is low,<br />
more harmonics are found than when the base frequency is high. The calculation rout<strong>in</strong>e will use up to 100 harmonics<br />
or up to a user def<strong>in</strong>ed number. This user def<strong>in</strong>ed number can be set by enter<strong>in</strong>g the Measure menu and select<strong>in</strong>g the<br />
item Max. number of harmonics to use. A new menu will pop up with the possible numbers.<br />
Perform<strong>in</strong>g cursor measurements<br />
Like <strong>in</strong> the oscilloscope, the spectrum analyzer has a set of cursors to perform measurements on the displayed signals.<br />
The cursors <strong>in</strong> the spectrum analyzer work almost like <strong>in</strong> the oscilloscope, so only the differences are discussed here.<br />
Refer to chapter 2, the oscilloscope, for more explanation on how to work with the cursors.<br />
Sett<strong>in</strong>g up the cursor measurements<br />
With the cursors it is possible to measure the <strong>in</strong>put signal(s) <strong>in</strong> several ways. To set up the cursor measurements,<br />
press the sett<strong>in</strong>gs button at the cursor readout w<strong>in</strong>dow (the right most button at the left top of the w<strong>in</strong>dow caption) A<br />
menu appears, conta<strong>in</strong><strong>in</strong>g the follow<strong>in</strong>g options. The menu can also be called by press<strong>in</strong>g the right mouse button over<br />
the table.<br />
Time<br />
Frequency left:<br />
Frequency right:<br />
Frequency difference:<br />
the frequency at the position of the left cursor is determ<strong>in</strong>ed.<br />
the frequency at the position of the right cursor is determ<strong>in</strong>ed.<br />
the frequency difference between the left and right cursor is determ<strong>in</strong>ed.<br />
Voltage<br />
Voltage left:<br />
Voltage right:<br />
the voltage of the left cursor will be displayed.<br />
the voltage of the right cursor will be displayed.<br />
The Spectrum Analyzer<br />
67
<strong>DI</strong>-<strong>770</strong> and WINDAQ/Scope Manual<br />
Voltage difference:<br />
the difference between the voltage of the left and the voltage of the right cursor is calculated.<br />
Select<strong>in</strong>g the m<strong>in</strong> and max of the signal, the top-top value is calculated.<br />
Distortion<br />
The Total Harmonic Distortion of the <strong>in</strong>put signal is determ<strong>in</strong>ed. Up to 100 harmonics are used for the calculation<br />
Automatic track<strong>in</strong>g cursors<br />
If this option is enabled, the voltage levels of the cursors are automatically set to the voltage levels of the sample<br />
numbers which correspond to the left and right cursor.<br />
Calculate values<br />
If this option is disabled, no new calculations will be d<strong>one</strong> until the option is enabled.<br />
Show measurement name<br />
Show measured value<br />
Show measurement unit<br />
To reduce the space used by the w<strong>in</strong>dow on the screen, the measurement name, value and/or unit can be hidden.<br />
This results <strong>in</strong> the disappearance of the correspond<strong>in</strong>g column which results <strong>in</strong> a smaller w<strong>in</strong>dow.<br />
Display font<br />
By select<strong>in</strong>g this option, the font which is used to display the str<strong>in</strong>gs and values can be changed. The font sett<strong>in</strong>gs<br />
which can be changed are: font name, font style, font size and the font color.<br />
Background color<br />
By select<strong>in</strong>g this option, the background color can be changed. Some font colors like e.g. light green are not show<strong>in</strong>g<br />
up very good on a white background. Change the background color to, e.g. black for a better result.<br />
The Spectrum Analyzer<br />
68
<strong>DI</strong>-<strong>770</strong> and WINDAQ/Scope Manual<br />
10. The Function Generator<br />
The <strong>DI</strong>-<strong>770</strong> is also equipped with a function generator.<br />
With the function generator, signals of various shapes, with adjustable frequency, symmetry, amplitude and offset.<br />
Next to that, the function generator conta<strong>in</strong>s a sweep generator, which can <strong>in</strong> comb<strong>in</strong>ation with the spectrum analyzer,<br />
be used for creat<strong>in</strong>g frequency response characteristics of comp<strong>one</strong>nts or circuits.<br />
And the function generator <strong>provides</strong> for a number of user def<strong>in</strong>able preset positions.<br />
Pr<strong>in</strong>ciple of the function generator<br />
The function generator uses the DDS technique. DDS stands for Direct Digital Synthesis, a technique that uses digital<br />
data process<strong>in</strong>g blocks to generate a frequency-tunable with a fixed-frequency precision clock. DDS allows to<br />
generate low distortion signals with very accurate frequency adjustment, <strong>in</strong> a fully digital way.<br />
Structure of the function generator<br />
The function generator is built out of a number of functional blocks.<br />
At the top a display is located, which shows the signal shape and the other sett<strong>in</strong>gs of the function generator. Left of<br />
the display there are the signal shape selector buttons. Below the display are the controls for the frequency, symmetry,<br />
amplitude and offset of the signal. At the right of the display are a key pad for numerical <strong>in</strong>put and a key pad for the<br />
presets.<br />
This part of the screen can be hidden us<strong>in</strong>g the small button at the right upper corner of the display of the function<br />
generator. The function generator will become smaller and tak<strong>in</strong>g up less space on the computer display. Press<strong>in</strong>g the<br />
button aga<strong>in</strong> will expand the w<strong>in</strong>dow aga<strong>in</strong>. The same can be obta<strong>in</strong>ed by press<strong>in</strong>g keys .<br />
The Function Generator<br />
69
<strong>DI</strong>-<strong>770</strong> and WINDAQ/Scope Manual<br />
Controll<strong>in</strong>g the function generator<br />
Signal shape<br />
With the signal shape selector buttons the signal type can be set. Possible signals are:<br />
S<strong>in</strong>e<br />
Triangle<br />
Square<br />
DC<br />
White noise<br />
File<br />
a s<strong>in</strong>e wave is generated<br />
a triangle wave is generated<br />
a square wave is generated<br />
a constant DC level is generated<br />
a white noise is generated<br />
a signal from a file is generated<br />
The signal type File is discussed later.<br />
Frequency<br />
In the Frequency box all controls for adjust<strong>in</strong>g the signal frequency are located. Seven decade buttons set a frequency<br />
range <strong>in</strong> which the frequency can be set us<strong>in</strong>g the slider. Each range runs from 0.2 to 2 times the value on the button.<br />
When the signal shape is set to DC, the frequency adjustment is disabled.<br />
Symmetry<br />
The symmetry of a signal <strong>in</strong>dicates the relation between the length of the positive part of the period to the total length<br />
of the period. A symmetry of 50% means that the positive part is exactly half of the total period.<br />
Us<strong>in</strong>g the slider <strong>in</strong> the Symmetry box, the symmetry can be adjusted between 1% and 99%. The Mid button sets the<br />
symmetry to 50%, the centre position.<br />
When the signal shape is set to DC or White noise, the symmetry adjustment is disabled.<br />
The Function Generator<br />
70
<strong>DI</strong>-<strong>770</strong> and WINDAQ/Scope Manual<br />
Amplitude<br />
The amplitude of the output signal can be adjusted <strong>in</strong> three ranges: not attenuated, -20 dB attenuated or -40 dB attenuated.<br />
With the slider a voltage between 0 Volt and 12 Volt (or 0 Volt and 10 Volt, depend<strong>in</strong>g on the <strong>in</strong>strument) can<br />
be set.<br />
DC offset<br />
It is possible to add a DC offset to the output signal. In the DC offset box there is a slider for the amplitude of the offset.<br />
The button will set the DC offset back to zero.<br />
When the signal shape is set to DC, the slider is used to toggle the polarity of the DC signal<br />
Numerical <strong>in</strong>put<br />
All described functions can also be controlled us<strong>in</strong>g the keyboard. When the w<strong>in</strong>dow is expanded, a small key pad is<br />
located which enables enter<strong>in</strong>g all sett<strong>in</strong>gs.<br />
This key pad can be controlled by mouse but also with the keyboard of the computer. In that case, the w<strong>in</strong>dow doesn't<br />
need to be expanded.<br />
The top four keys <strong>in</strong>dicate which sett<strong>in</strong>g will be adjusted. The correspond<strong>in</strong>g read<strong>in</strong>g <strong>in</strong> the display will start bl<strong>in</strong>k<strong>in</strong>g.<br />
Also the numerical keys will be enabled and the required value can be entered. The <strong>in</strong>put can be ended by press<strong>in</strong>g<br />
the key.<br />
The follow<strong>in</strong>g keys are available:<br />
Adjust the symmetry of the signal<br />
Adjust the DC offset of the signal<br />
The Function Generator<br />
71
<strong>DI</strong>-<strong>770</strong> and WINDAQ/Scope Manual<br />
Adjust the amplitude of the signal<br />
Adjust the frequency of the signal<br />
...<br />
Add this figure to the entered number<br />
Add a decimal po<strong>in</strong>t to the entered number<br />
Reverse the polarity of the entered number<br />
Term<strong>in</strong>ate the <strong>in</strong>put<br />
Remove the last entered character<br />
End the <strong>in</strong>put and apply it<br />
Term<strong>in</strong>ate the <strong>in</strong>put<br />
Presets<br />
The function generator has 8 preset positions to store signal sett<strong>in</strong>gs.<br />
With a s<strong>in</strong>gle press on a button, a signal with a specified shape, amplitude, offset, frequency and symmetry can be<br />
generated.<br />
The presets are stored together with the application sett<strong>in</strong>gs and are restored each time the application is started.<br />
Stor<strong>in</strong>g<br />
When a signal is set that is not yet stored <strong>in</strong> a preset position, and there is a free preset position available, the store<br />
button is enabled. By press<strong>in</strong>g the button, the signal sett<strong>in</strong>gs are stored <strong>in</strong> the free preset position with the lowest<br />
number.<br />
The Function Generator<br />
72
<strong>DI</strong>-<strong>770</strong> and WINDAQ/Scope Manual<br />
Select<strong>in</strong>g<br />
When presets are stored, the correspond<strong>in</strong>g preset buttons are enabled. By hover<strong>in</strong>g the mouse po<strong>in</strong>ter over <strong>one</strong> of the<br />
buttons, the sett<strong>in</strong>gs of that preset position are displayed.<br />
By press<strong>in</strong>g a preset button, the function generator is set accord<strong>in</strong>g to the stored sett<strong>in</strong>gs. The button of the preset will<br />
be lowered, <strong>in</strong>dicat<strong>in</strong>g that preset is active.<br />
When dur<strong>in</strong>g use of the function generator a sett<strong>in</strong>g is changed, and the new sett<strong>in</strong>g corresponds with a stored preset,<br />
the correspond<strong>in</strong>g button of that preset will be lowered. When a preset is selected and the sett<strong>in</strong>g of the function generator<br />
is changed to a sett<strong>in</strong>g that does not correspond with the preset, the correspond<strong>in</strong>g button will be raised.<br />
Clear<strong>in</strong>g<br />
To clear a stored preset, it first needs to be selected by press<strong>in</strong>g the correspond<strong>in</strong>g button.<br />
The clear button will become active. Press<strong>in</strong>g this button will clear the preset position and make the location available<br />
for a new preset. The correspond<strong>in</strong>g button will be disabled.<br />
Perform<strong>in</strong>g a sweep<br />
The function generator offers, <strong>in</strong> comb<strong>in</strong>ation with the spectrum analyzer, the possibility to generate a signal with a<br />
frequency sweep.<br />
For this purpose the spectrum analyzer needs to be active as well. After each measurement the spectrum analyzer performs,<br />
the frequency of the generator is <strong>in</strong>creased with a certa<strong>in</strong> step size, until the highest value is reached. In that<br />
case the frequency will be set to the lowest value.<br />
Below the signal shape buttons is a sweep button located, for sett<strong>in</strong>g the sweep parameters. Next to the button there is<br />
an on/off button, for switch<strong>in</strong>g the sweep function on and off. When the sweep button is pressed, the sweep generator<br />
sett<strong>in</strong>gs dialog is displayed.<br />
In this dialog all sett<strong>in</strong>gs of the sweep can be made.<br />
The easiest sett<strong>in</strong>g is Fully controlled by spectrum analyzer. In this sett<strong>in</strong>g, the sett<strong>in</strong>g of the frequency axis of the<br />
spectrum analyzer determ<strong>in</strong>es how the start and stop frequency and the frequency step size are set. The lowest visible<br />
The Function Generator<br />
73
<strong>DI</strong>-<strong>770</strong> and WINDAQ/Scope Manual<br />
frequency <strong>in</strong> the spectrum analyzer sets the start frequency of the sweep. The highest visible frequency <strong>in</strong> the spectrum<br />
analyzer sets the stop frequency of the sweep. This is limited to the maximum range of the function generator.<br />
The frequency step size is determ<strong>in</strong>ed by the frequency range of the spectrum analyzer, divided by the number of b<strong>in</strong>s<br />
<strong>in</strong> the spectrum. When a sweep is active and a sett<strong>in</strong>g <strong>in</strong> the spectrum analyzer is changed, the sweep parameters will<br />
change accord<strong>in</strong>gly.<br />
At each step, the frequency of the generator will be set to a value that falls exactly <strong>in</strong> <strong>one</strong> s<strong>in</strong>gle b<strong>in</strong>, therefor no calculation<br />
errors occur and no w<strong>in</strong>dow is required.<br />
The sett<strong>in</strong>g Manual requires that all sett<strong>in</strong>gs are set by the user. The start and stop frequency can be set freely. The frequency<br />
axis of the spectrum analyzer will be set accord<strong>in</strong>gly, so only the range that is sweeped will be visible.<br />
The frequency step size can be determ<strong>in</strong>ed from the spectrum length. With each step a frequency will be set that generates<br />
no calculation errors. It's also possible to set the step size manually, but that will probably do generate calculation<br />
errors <strong>in</strong> the FFT.<br />
H<strong>in</strong>t: For easy creat<strong>in</strong>g frequency response characteristics, set the measure mode of the spectrum analyzer to Measure<br />
maximum values and switch off autorang<strong>in</strong>g for the channels<br />
After sett<strong>in</strong>g the sweep parameters, the sweep function can be switched on us<strong>in</strong>g the on/off button. Dur<strong>in</strong>g the sweep,<br />
the frequency readout <strong>in</strong> the display will follow the output frequency.<br />
Note: When the sweep function is used to determ<strong>in</strong>e frequency response characteristics, be certa<strong>in</strong> to set the signal<br />
shape to S<strong>in</strong>e.<br />
Generat<strong>in</strong>g a previous measured signal from a file<br />
It is possible to generate previously measured signals with the function generator, provided of course that the amplitude<br />
and frequency of the signal are with<strong>in</strong> the specs of the generator.<br />
Measur<strong>in</strong>g and stor<strong>in</strong>g a signal<br />
The function generator has two possibilities to generate previous measured signals. It can either use the DDS mode or<br />
it can use a l<strong>in</strong>ear mode.<br />
In the DDS mode, a waveform of 1024 po<strong>in</strong>ts is used to generate the signal. Due to the DDS technique, very accurate<br />
output signal frequencies can be obta<strong>in</strong>ed.<br />
In l<strong>in</strong>ear mode, a waveform of 64K po<strong>in</strong>ts is used. The sample clock of the generator can be set to a number of sett<strong>in</strong>gs,<br />
<strong>in</strong> order to obta<strong>in</strong> different output frequencies. The number of sett<strong>in</strong>gs is limited. When a stored waveform is<br />
used that is smaller than 64K po<strong>in</strong>ts, the rema<strong>in</strong><strong>in</strong>g po<strong>in</strong>ts are filled with a 0 volt value.<br />
A signal that is measured, stored and later generated, has to meet certa<strong>in</strong> po<strong>in</strong>ts, <strong>in</strong> order to be usable.<br />
• The signal has to be measured <strong>in</strong> channel 1 of the scope.<br />
• For DDS mode, the record length of the scope has to be set to 1024 po<strong>in</strong>ts, for l<strong>in</strong>ear mode to any required<br />
length, but 64K is preferred.<br />
• If possible, the sampl<strong>in</strong>g frequency of the scope has to be set <strong>in</strong> such a way that exactly 1 period of the signal is<br />
captured <strong>in</strong> the 1024 po<strong>in</strong>ts or 64K po<strong>in</strong>ts.<br />
After the signal is measured, it can be saved to disk us<strong>in</strong>g Save waveform... from the File-menu.<br />
Sett<strong>in</strong>g the function generator<br />
At the left hand side of the display <strong>in</strong> the generator, a number of signal shape buttons are located, <strong>one</strong> of them is<br />
named File. With this button a signal from a file can be selected and loaded <strong>in</strong>to the generator.<br />
Press<strong>in</strong>g this button will pop up a file selection dialog <strong>in</strong> which the proper waveform file can be selected.<br />
After read<strong>in</strong>g the signal, the amplitude and frequency of the signal can be adjusted us<strong>in</strong>g the proper controls.<br />
The Function Generator<br />
74
DATAQ Instruments, Inc.<br />
241 Spr<strong>in</strong>gside Drive<br />
Akron, Ohio 44333<br />
Teleph<strong>one</strong>: 330-668-1444<br />
Fax: 330-666-5434<br />
E-mail: support@dataq.com<br />
Direct Product L<strong>in</strong>ks<br />
(click on text to jump to page)<br />
Data Acquisition | Data Logger | Chart Recorder | Thermocouple | <strong>Oscilloscope</strong>