Market Analysis Tools and Services - UNCTAD Virtual Institute
Market Analysis Tools and Services - UNCTAD Virtual Institute
Market Analysis Tools and Services - UNCTAD Virtual Institute

You also want an ePaper? Increase the reach of your titles
YUMPU automatically turns print PDFs into web optimized ePapers that Google loves.
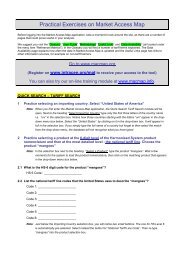
Practical exercice<br />
48. Export mapping: create a map to illustrate the list of importing markets for all products<br />
exported by the selected country in 2009.<br />
Your answer: insert the map here<br />
Note: Click on the tab “Map”, <strong>and</strong> then do a “print-screen” to insert the map into the Word<br />
format.<br />
Comments about the map:<br />
Interesting: by selecting different types of first <strong>and</strong> second trade indicators <strong>and</strong> using the<br />
zoom function, you can easily illustrate which country are the main importing countries in<br />
terms of value <strong>and</strong> dynamism.<br />
49. Export Dynamism: create a graph to illustrate the import dynamism of the top ten importing<br />
markets for all the products exported by the selected country in 2009.<br />
Your answer: insert the graph here<br />
Note: Click on the tab “Table”, then select the Bar chart on exported value. Insert the bar<br />
chart into the Word format.<br />
Comments about the bar chart:<br />
Interesting: by selecting different type of first <strong>and</strong> second trade indicators, you can easily<br />
illustrate which countries are the main importing countries in terms of value <strong>and</strong> dynamism.<br />
50. Export Concentration: create the bubble graph on “Prospect for market diversification” to<br />
illustrate the share in the country’s total exports of the top 20 importing countries<br />
compared to their overall import dynamism.<br />
Your answer: insert the bubble graph here<br />
Comments about the map: