SIBER SPIS sept 2011.pdf - IMBER
SIBER SPIS sept 2011.pdf - IMBER
SIBER SPIS sept 2011.pdf - IMBER

Create successful ePaper yourself
Turn your PDF publications into a flip-book with our unique Google optimized e-Paper software.
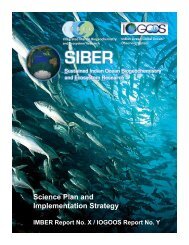
<strong>SIBER</strong><br />
Science Plan and Implementation Strategy<br />
NE Monsoon<br />
SW Monsoon<br />
20°N<br />
0<br />
20°S<br />
40°E 80°E 120°E 40°E 80°E 120°E<br />
20°N<br />
0<br />
20°S<br />
40°S<br />
40°E 80°E 120°E 40°E 80°E 120°E<br />
20°N<br />
0<br />
20°S<br />
40°E 80°E 120°E 40°E 80°E 120°E<br />
Chl a (mg/m 3 )<br />
0.00 0.15 0.30 0.45 0.60 0.75 1.00 1.50 3.50<br />
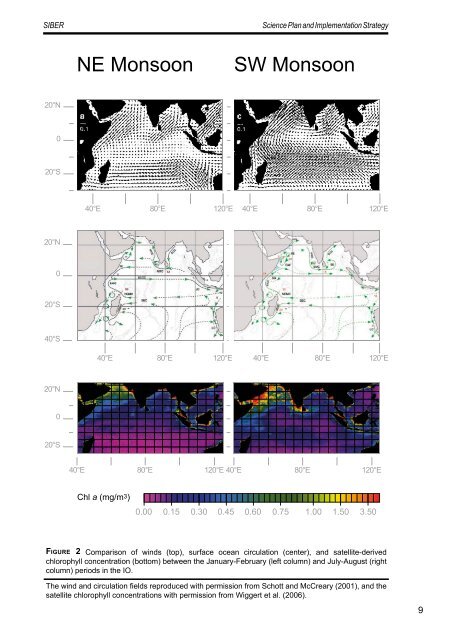
Fi g u r e 2 Comparison of winds (top), surface ocean circulation (center), and satellite-derived<br />
chlorophyll concentration (bottom) between the January-February (left column) and July-August (right<br />
column) periods in the IO.<br />
The wind and circulation fields reproduced with permission from Schott and McCreary (2001), and the<br />
satellite chlorophyll concentrations with permission from Wiggert et al. (2006).<br />
9