SIBER SPIS sept 2011.pdf - IMBER
SIBER SPIS sept 2011.pdf - IMBER
SIBER SPIS sept 2011.pdf - IMBER

You also want an ePaper? Increase the reach of your titles
YUMPU automatically turns print PDFs into web optimized ePapers that Google loves.
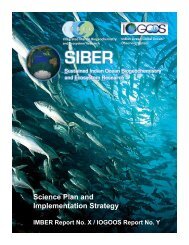
<strong>SIBER</strong><br />
Science Plan and Implementation Strategy<br />
Indian Ocean Warming<br />
1970-1999 (°C per century)<br />
20°N<br />
0<br />
20°S<br />
INDIAN OCEAN<br />
57%<br />
2<br />
0<br />
-2<br />
Heat content anomaly (1022J)<br />
40°E 80°E 120°E<br />
1950 1970 1990<br />
-2 -1,5 -1 -0,5 0 0,5 1 1,5 2<br />
Fi g u r e 14 Indian Ocean warming as assessed from satellite sea surface temperature data (left panel).<br />
Indian Ocean total heat content anomaly trend (right panel).<br />
Left panel reproduced with permission from International CLIVAR Project Office (2006). Right panel<br />
reproduced from Levitus et al. (2000).<br />
30°N<br />
Annual Mean Salinity (0-50m)<br />
Brahmaputra<br />
20°N<br />
Ganges<br />
Irrawaddy<br />
Arabian Sea<br />
Bay of Bengal<br />
10°N<br />
Andaman Sea<br />
EQ<br />
50°E 60°E 70°E 80°E 90°E 100°E<br />
20.0 33.6 34.2 34.8 35.4 36.0 36.6 37.2 50.0<br />
Fi g u r e 15 Annual mean salinity in the surface waters of the northern Indian Ocean.<br />
Data were obtained from the World Ocean Atlas 2001 (Conkright et al., 2002).<br />
27