Evaluation Findings - SAMHSA Store - Substance Abuse and Mental ...
Evaluation Findings - SAMHSA Store - Substance Abuse and Mental ...
Evaluation Findings - SAMHSA Store - Substance Abuse and Mental ...

Create successful ePaper yourself
Turn your PDF publications into a flip-book with our unique Google optimized e-Paper software.
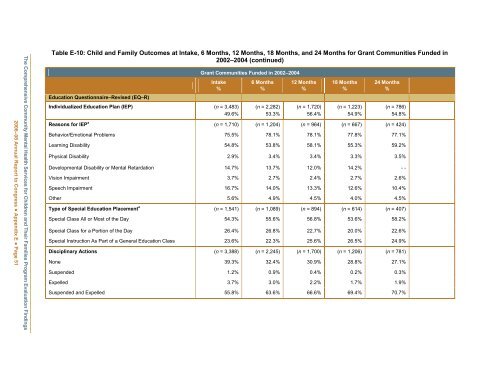
2006–08 Annual Report to Congress ● Appendix E ● Page 51<br />
The Comprehensive Community <strong>Mental</strong> Health Services for Children <strong>and</strong> Their Families Program <strong>Evaluation</strong> <strong>Findings</strong><br />
Table E-10: Child <strong>and</strong> Family Outcomes at Intake, 6 Months, 12 Months, 18 Months, <strong>and</strong> 24 Months for Grant Communities Funded in<br />
2002–2004 (continued)<br />
Education Questionnaire–Revised (EQ–R)<br />
Grant Communities Funded in 2002–2004<br />
Intake<br />
%<br />
Individualized Education Plan (IEP) (n = 3,483)<br />
49.6%<br />
6 Months<br />
%<br />
(n = 2,282)<br />
53.3%<br />
12 Months<br />
%<br />
(n = 1,720)<br />
56.4%<br />
18 Months<br />
%<br />
(n = 1,223)<br />
54.9%<br />
24 Months<br />
%<br />
(n = 786)<br />
54.8%<br />
Reasons for IEP a (n = 1,710) (n = 1,204) (n = 964) (n = 667) (n = 424)<br />
Behavior/Emotional Problems 75.5% 78.1% 78.1% 77.8% 77.1%<br />
Learning Disability 54.8% 53.8% 58.1% 55.3% 59.2%<br />
Physical Disability 2.9% 3.4% 3.4% 3.3% 3.5%<br />
Developmental Disability or <strong>Mental</strong> Retardation 14.7% 13.7% 12.0% 14.2% - -<br />
Vision Impairment 3.7% 2.7% 2.4% 2.7% 2.6%<br />
Speech Impairment 16.7% 14.0% 13.3% 12.6% 10.4%<br />
Other 5.6% 4.9% 4.5% 4.0% 4.5%<br />
Type of Special Education Placement a (n = 1,541) (n = 1,089) (n = 894) (n = 614) (n = 407)<br />
Special Class All or Most of the Day 54.3% 55.6% 56.8% 53.6% 58.2%<br />
Special Class for a Portion of the Day 26.4% 26.8% 22.7% 20.0% 22.6%<br />
Special Instruction As Part of a General Education Class 23.6% 22.3% 25.6% 26.5% 24.9%<br />
Disciplinary Actions (n = 3,388) (n = 2,245) (n = 1,700) (n = 1,206) (n = 781)<br />
None 39.3% 32.4% 30.9% 28.8% 27.1%<br />
Suspended 1.2% 0.9% 0.4% 0.2% 0.3%<br />
Expelled 3.7% 3.0% 2.2% 1.7% 1.9%<br />
Suspended <strong>and</strong> Expelled 55.8% 63.6% 66.6% 69.4% 70.7%