Evaluation Findings - SAMHSA Store - Substance Abuse and Mental ...
Evaluation Findings - SAMHSA Store - Substance Abuse and Mental ...
Evaluation Findings - SAMHSA Store - Substance Abuse and Mental ...

Create successful ePaper yourself
Turn your PDF publications into a flip-book with our unique Google optimized e-Paper software.
2006–2008 Annual Report to Congress ● Appendix C ● Page 4<br />
The Comprehensive Community <strong>Mental</strong> Health Services for Children <strong>and</strong> Their Families Program <strong>Evaluation</strong> <strong>Findings</strong><br />
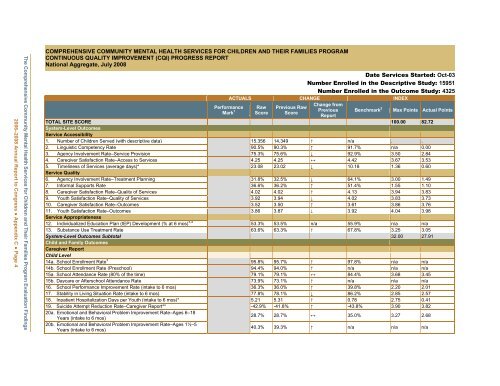
COMPREHENSIVE COMMUNITY MENTAL HEALTH SERVICES FOR CHILDREN AND THEIR FAMILIES PROGRAM<br />
CONTINUOUS QUALITY IMPROVEMENT (CQI) PROGRESS REPORT<br />
National Aggregate, July 2008<br />
Date Services Started: Oct-03<br />
Number Enrolled in the Descriptive Study: 15951<br />
Number Enrolled in the Outcome Study: 4325<br />
ACTUALS CHANGE INDEX<br />
Performance<br />
Mark 1<br />
Raw<br />
Score<br />
Previous Raw<br />
Score<br />
Change from<br />
Previous<br />
Report<br />
Benchmark 2<br />
Max Points Actual Points<br />
TOTAL SITE SCORE 100.00 82.72<br />
System-Level Outcomes<br />
Service Accessibility<br />
1. Number of Children Served (with descriptive data) 15,356 14,349 ↑ n/a . .<br />
2. Linguistic Competency Rate 90.5% 90.3% ↑ 91.7% n/a 0.00<br />
3. Agency Involvement Rate–Service Provision 75.3% 75.6% ↓ 92.9% 3.50 2.84<br />
4. Caregiver Satisfaction Rate–Access to Services 4.25 4.25 ↔ 4.42 3.67 3.53<br />
5. Timeliness of Services (average days)* 23.08 23.02 ↓ 10.18 1.36 0.60<br />
Service Quality<br />
6. Agency Involvement Rate–Treatment Planning 31.8% 32.5% ↓ 64.1% 3.00 1.49<br />
7. Informal Supports Rate 36.6% 36.2% ↑ 51.4% 1.55 1.10<br />
8. Caregiver Satisfaction Rate–Quality of Services 4.02 4.02 ↑ 4.13 3.94 3.83<br />
9. Youth Satisfaction Rate–Quality of Services 3.92 3.94 ↓ 4.02 3.83 3.73<br />
10. Caregiver Satisfaction Rate–Outcomes 3.52 3.50 ↑ 3.61 3.86 3.76<br />
11. Youth Satisfaction Rate–Outcomes 3.86 3.87 ↓ 3.92 4.04 3.98<br />
Service Appropriateness<br />
12. Individualized Education Plan (IEP) Development (% at 6 mos) 3,4 53.3% 53.5% n/a 55.9% n/a n/a<br />
13. <strong>Substance</strong> Use Treatment Rate 63.6% 63.3% ↑ 67.8% 3.25 3.05<br />
System-Level Outcomes Subtotal 32.00 27.91<br />
Child <strong>and</strong> Family Outcomes<br />
Caregiver Report<br />
Child Level<br />
14a. School Enrollment Rate 3 95.8% 95.7% ↑ 97.8% n/a n/a<br />
14b. School Enrollment Rate (Preschool) 94.4% 94.0% ↑ n/a n/a n/a<br />
15a. School Attendance Rate (80% of the time) 79.1% 79.1% ↔ 84.4% 3.68 3.45<br />
15b. Daycare or Afterschool Attendance Rate 73.9% 73.1% ↑ n/a n/a n/a<br />
16. School Performance Improvement Rate (intake to 6 mos) 36.3% 36.0% ↑ 39.8% 2.20 2.01<br />
17. Stability in Living Situation Rate (intake to 6 mos) 77.8% 78.1% ↓ 86.2% 2.85 2.57<br />
18. Inpatient Hospitalization Days per Youth (intake to 6 mos)* 5.21 5.31 ↑ 0.78 2.75 0.41<br />
19. Suicide Attempt Reduction Rate–Caregiver Report** -42.9% -41.8% ↑ -43.8% 3.90 3.82<br />
20a. Emotional <strong>and</strong> Behavioral Problem Improvement Rate–Ages 6–18<br />
Years (intake to 6 mos)<br />
28.7% 28.7% ↔ 35.0% 3.27 2.68<br />
20b. Emotional <strong>and</strong> Behavioral Problem Improvement Rate–Ages 1½–5<br />
Years (intake to 6 mos)<br />
40.3% 39.3% ↑ n/a n/a n/a