6th International Workshop on Breast Densitometry and Breast ...
6th International Workshop on Breast Densitometry and Breast ...
6th International Workshop on Breast Densitometry and Breast ...
- No tags were found...
Create successful ePaper yourself
Turn your PDF publications into a flip-book with our unique Google optimized e-Paper software.
P13<br />
6 th <str<strong>on</strong>g>Internati<strong>on</strong>al</str<strong>on</strong>g> <str<strong>on</strong>g>Workshop</str<strong>on</strong>g> <strong>on</strong> <strong>Breast</strong> <strong>Densitometry</strong><br />
<strong>and</strong> <strong>Breast</strong> Cancer Risk Assessment<br />
RISK ASSOCIATION OF SUBREGIONAL MEASUREMENTS OF BREAST<br />
DENSITY<br />
Duewer, Fred 1 , Fan, Bo 1 , Karla, Kerlikowske 2,3 , Ma, Lin 2,3 , Malkov, Serghei 1 , <strong>and</strong> Shepherd, John 1<br />
University of California, San Francisco, Department of Radiology 1 , Department of Epidemiology <strong>and</strong><br />
Biostatistics 2 , <strong>and</strong> Department of Medicine 3<br />
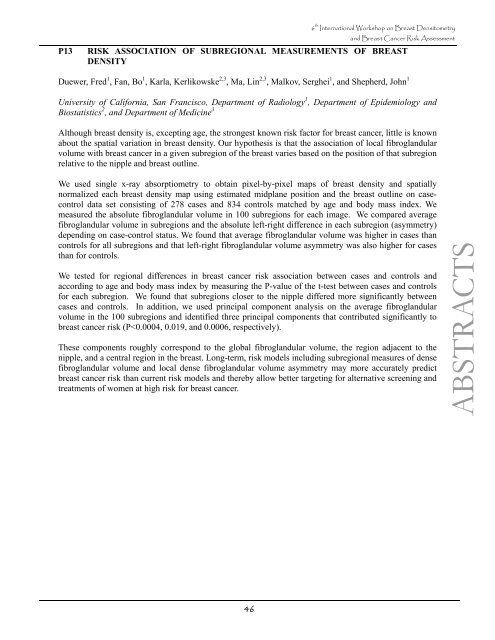
Although breast density is, excepting age, the str<strong>on</strong>gest known risk factor for breast cancer, little is known<br />
about the spatial variati<strong>on</strong> in breast density. Our hypothesis is that the associati<strong>on</strong> of local fibrogl<strong>and</strong>ular<br />
volume with breast cancer in a given subregi<strong>on</strong> of the breast varies based <strong>on</strong> the positi<strong>on</strong> of that subregi<strong>on</strong><br />
relative to the nipple <strong>and</strong> breast outline.<br />
We used single x-ray absorptiometry to obtain pixel-by-pixel maps of breast density <strong>and</strong> spatially<br />
normalized each breast density map using estimated midplane positi<strong>on</strong> <strong>and</strong> the breast outline <strong>on</strong> casec<strong>on</strong>trol<br />
data set c<strong>on</strong>sisting of 278 cases <strong>and</strong> 834 c<strong>on</strong>trols matched by age <strong>and</strong> body mass index. We<br />
measured the absolute fibrogl<strong>and</strong>ular volume in 100 subregi<strong>on</strong>s for each image. We compared average<br />
fibrogl<strong>and</strong>ular volume in subregi<strong>on</strong>s <strong>and</strong> the absolute left-right difference in each subregi<strong>on</strong> (asymmetry)<br />
depending <strong>on</strong> case-c<strong>on</strong>trol status. We found that average fibrogl<strong>and</strong>ular volume was higher in cases than<br />
c<strong>on</strong>trols for all subregi<strong>on</strong>s <strong>and</strong> that left-right fibrogl<strong>and</strong>ular volume asymmetry was also higher for cases<br />
than for c<strong>on</strong>trols.<br />
We tested for regi<strong>on</strong>al differences in breast cancer risk associati<strong>on</strong> between cases <strong>and</strong> c<strong>on</strong>trols <strong>and</strong><br />
according to age <strong>and</strong> body mass index by measuring the P-value of the t-test between cases <strong>and</strong> c<strong>on</strong>trols<br />
for each subregi<strong>on</strong>. We found that subregi<strong>on</strong>s closer to the nipple differed more significantly between<br />
cases <strong>and</strong> c<strong>on</strong>trols. In additi<strong>on</strong>, we used principal comp<strong>on</strong>ent analysis <strong>on</strong> the average fibrogl<strong>and</strong>ular<br />
volume in the 100 subregi<strong>on</strong>s <strong>and</strong> identified three principal comp<strong>on</strong>ents that c<strong>on</strong>tributed significantly to<br />
breast cancer risk (P


