Annual Report 2010 - ProCredit Bank
Annual Report 2010 - ProCredit Bank
Annual Report 2010 - ProCredit Bank
- No tags were found...

Create successful ePaper yourself
Turn your PDF publications into a flip-book with our unique Google optimized e-Paper software.
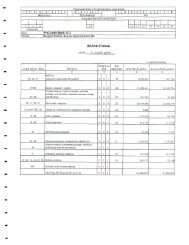
Financial Statements 69<br />
31 December <strong>2010</strong> Up to 1 – 3 3 – 12 1 – 2 2 – 5 over 5 Non-Interest Total<br />
1 month months months years years years Bearing<br />
Assets<br />
Cash and balances with<br />
the Central <strong>Bank</strong> – – – – – – 21,025,345 21,025,345<br />
Loans and advances<br />
to banks – – – – – – 713,645 713,645<br />
Loans and advances<br />
to customers 20,195,363 2,615,628 10,136,201 6,573,369 6,597,423 367,418 490,955 46,976,357<br />
Derivative Financial<br />
Assets – – – – – – 105 105<br />
Available-for-sale<br />
financial assets – – – – – – 13,618 13,618<br />
Other financial<br />
investments – – – – – – 7,924 7,924<br />
Other assets – – – – – – 375,794 375,794<br />
Total assets 20,195,363 2,615,628 10,136,201 6,573,369 6,597,423 367,418 22,627,386 69,112,788<br />
Liabilities<br />
Liabilities to banks 2,195,180 – – – – – – 2,195,180<br />
Derivative financial<br />
liabilities – – 5,649 – – – – 5,649<br />
Due to customers 11,536,786 6,227,789 9,825,335 191,503 315,460 76,256 8,959,597 37,132,726<br />
Other borrowed funds 4,096,457 3,562,136 5,892,627 624,490 4,930,705 – 244,369 19,350,784<br />
Subordinated debt – – – – 2,886,643 – – 2,886,643<br />
Other liabilities – – – – – – 568,952 568,952<br />
Total liabilities 17,828,423 9,789,925 15,723,611 815,993 8,132,808 76,256 9,772,918 62,139,934<br />
Interest sensitivity gap 2,366,940 (7,174,297) (5,587,410) 5,757,376 (1,535,385) 291,162 12,854,468 6,972,854<br />
31 December 2009<br />
Total Assets 18,098,739 2,995,595 9,285,638 7,129,894 8,401,263 629,121 17,839,945 64,380,195<br />
Total Liabilities 18,475,793 8,038,183 12,052,248 1,452,038 9,201,665 454,517 7,079,199 57,726,643<br />
Interest sensitivity gap (377,054) (5,042,588) (2,766,610) 5,677,856 (800,402) 174,604 10,760,746 6,653,552<br />
Negative gap in time brackets in the table shown above is the consequence<br />
of significant volume of assets being immobilized in<br />
minimum reserves. Part of the minimum reserves kept in foreign<br />
currency is not interest rate sensitive.<br />
At 31 December 2009, if interest rates had been 200 basis points<br />
lower with all other variables were held constant, the Group’s profit<br />
for the year would respectively increase by approximately RSD<br />
112,861 thousand (2008: increase by RSD 8,803 thousand). The<br />
following table indicates influence in the movements of interest<br />
rates to profit/loss for 2009 and 2008 respectively.<br />
Income statement sensitivity to change in interest rates<br />
2% increase of interest rates 2% decrease of interest rates<br />
Total EUR RSD Total EUR RSD<br />
31 December <strong>2010</strong> (58,640) (71,852) 17,342 58,640 71,852 (17,342)<br />
Income statement sensitivity to change in interest rates<br />
2% increase of interest rates 2% decrease of interest rates<br />
Total EUR RSD Total EUR RSD<br />
31 December 2009 (112,861) (112,957) 2,685 112,861 112,957 (2,685)<br />
At 31 December 2009, if interest rates had been 200 basis points<br />
lower with all other variables were held constant, the Group’s economic<br />
value of the capital would respectively increase by approximately<br />
RSD 259,901 thousand (2008: decrease by RSD 256,780<br />
thousand). The following table indicates influence in the movements<br />
of interest rates to economic value of the Group’s capital for<br />
31 December 2009 and 2008 respectively.