PCT Yearly Review - WIPO
PCT Yearly Review - WIPO
PCT Yearly Review - WIPO

Create successful ePaper yourself
Turn your PDF publications into a flip-book with our unique Google optimized e-Paper software.
special theme<br />
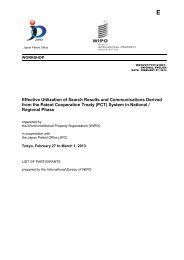
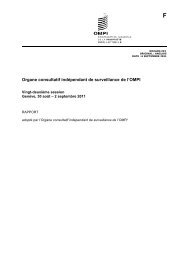
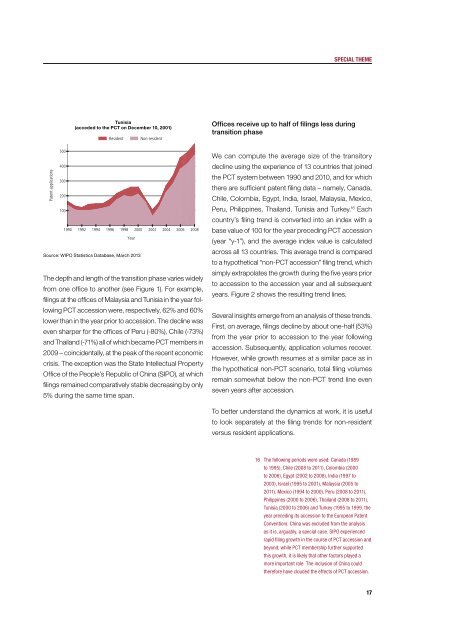
Tunisia<br />
(acceded to the <strong>PCT</strong> on December 10, 2001)<br />
Resident<br />
Non-resident<br />
Offices receive up to half of filings less during<br />
transition phase<br />
Patent applications<br />
500<br />
400<br />
300<br />
200<br />
100<br />
1990 1992 1994 1996 1998 2000 2002 2004 2006 2008<br />
Year<br />
Source: <strong>WIPO</strong> Statistics Database, March 2013<br />
The depth and length of the transition phase varies widely<br />
from one office to another (see Figure 1). For example,<br />
filings at the offices of Malaysia and Tunisia in the year following<br />
<strong>PCT</strong> accession were, respectively, 62% and 60%<br />
lower than in the year prior to accession. The decline was<br />
even sharper for the offices of Peru (-80%), Chile (-73%)<br />
and Thailand (-71%) all of which became <strong>PCT</strong> members in<br />
2009 – coincidentally, at the peak of the recent economic<br />
crisis. The exception was the State Intellectual Property<br />
Office of the People’s Republic of China (SIPO), at which<br />
filings remained comparatively stable decreasing by only<br />
5% during the same time span.<br />
We can compute the average size of the transitory<br />
decline using the experience of 13 countries that joined<br />
the <strong>PCT</strong> system between 1990 and 2010, and for which<br />
there are sufficient patent filing data – namely, Canada,<br />
Chile, Colombia, Egypt, India, Israel, Malaysia, Mexico,<br />
Peru, Philippines, Thailand, Tunisia and Turkey. 16 Each<br />
country’s filing trend is converted into an index with a<br />
base value of 100 for the year preceding <strong>PCT</strong> accession<br />
(year “y-1”), and the average index value is calculated<br />
across all 13 countries. This average trend is compared<br />
to a hypothetical “non-<strong>PCT</strong> accession” filing trend, which<br />
simply extrapolates the growth during the five years prior<br />
to accession to the accession year and all subsequent<br />
years. Figure 2 shows the resulting trend lines.<br />
Several insights emerge from an analysis of these trends.<br />
First, on average, filings decline by about one-half (53%)<br />
from the year prior to accession to the year following<br />
accession. Subsequently, application volumes recover.<br />
However, while growth resumes at a similar pace as in<br />
the hypothetical non-<strong>PCT</strong> scenario, total filing volumes<br />
remain somewhat below the non-<strong>PCT</strong> trend line even<br />
seven years after accession.<br />
To better understand the dynamics at work, it is useful<br />
to look separately at the filing trends for non-resident<br />
versus resident applications.<br />
16 The following periods were used: Canada (1989<br />
to 1995), Chile (2008 to 2011), Colombia (2000<br />
to 2006), Egypt (2002 to 2008), India (1997 to<br />
2003), Israel (1995 to 2001), Malaysia (2005 to<br />
2011), Mexico (1994 to 2000), Peru (2008 to 2011),<br />
Philippines (2000 to 2006), Thailand (2008 to 2011),<br />
Tunisia (2000 to 2006) and Turkey (1995 to 1999, the<br />
year preceding its accession to the European Patent<br />
Convention). China was excluded from the analysis<br />
as it is, arguably, a special case. SIPO experienced<br />
rapid filing growth in the course of <strong>PCT</strong> accession and<br />
beyond; while <strong>PCT</strong> membership further supported<br />
this growth, it is likely that other factors played a<br />
more important role. The inclusion of China could<br />
therefore have clouded the effects of <strong>PCT</strong> accession.<br />
17