PCT Yearly Review - WIPO
PCT Yearly Review - WIPO
PCT Yearly Review - WIPO

You also want an ePaper? Increase the reach of your titles
YUMPU automatically turns print PDFs into web optimized ePapers that Google loves.
Section A<br />
use of the pct system<br />
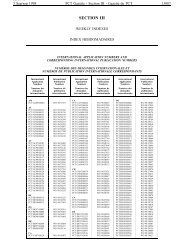
A.3.4 List of top <strong>PCT</strong> applicants: universities<br />
The University of California remained the largest filer<br />
among educational institutions with 351 published applications<br />
in 2012, followed by Massachusetts Institute<br />
of Technology (168) and Harvard University (146). Only<br />
seven applicants had more than 100 applications published<br />
in 2012. The University of California was the only<br />
educational institution that ranked among the overall top<br />
50 <strong>PCT</strong> applicants in 2012.<br />
The number of applications published in 2012 compared to<br />
2011 increased for the majority of applicants. The University<br />
of California saw the strongest increase in published applications<br />
(+74), followed by Peking University (+63). By contrast,<br />
the University of Michigan (-37) and Tokyo University<br />
(-32) saw the largest drops in published applications.<br />
The US dominates the list of top university applicants,<br />
with 27 out of these 52 applicants, followed by Japan<br />
and the Republic of Korea with 6 each.<br />
Table A.3.4: Top 50 <strong>PCT</strong> applicants: universities<br />
<strong>PCT</strong> applications<br />
Rank Applicant’s Name Origin<br />
Change compared<br />
2010 2011 2012<br />
to 2011<br />
1 UNIVERSITY OF CALIFORNIA United States of America 304 277 351 74<br />
2 MASSACHUSETTS INSTITUTE OF TECHNOLOGY United States of America 146 179 168 -11<br />
3 HARVARD UNIVERSITY United States of America 91 88 146 58<br />
4 JOHNS HOPKINS UNIVERSITY United States of America 89 111 141 30<br />
5 COLUMBIA UNIVERSITY United States of America 91 82 114 32<br />
5 UNIVERSITY OF TEXAS SYSTEM United States of America 129 127 114 -13<br />
7 SEOUL NATIONAL UNIVERSITY Republic of Korea 97 99 101 2<br />
8 LELAND STANFORD JUNIOR UNIVERSITY United States of America 54 79 95 16<br />
9 PEKING UNIVERSITY China 26 29 92 63<br />
10 UNIVERSITY OF FLORIDA United States of America 107 84 89 5<br />
11 CALIFORNIA INSTITUTE OF TECHNOLOGY United States of America 50 59 88 29<br />
12 KOREA ADVANCED INSTITUTE OF SCIENCE AND TECHNOLOGY Republic of Korea 51 103 82 -21<br />
13 CORNELL UNIVERSITY United States of America 81 88 73 -15<br />
14 UNIVERSITY OF TOKYO Japan 105 98 66 -32<br />
15 YONSEI UNIVERSITY Republic of Korea 38 43 65 22<br />
16 TSINGHUA UNIVERSITY China 24 36 62 26<br />
16 ISIS INNOVATION LIMITED United Kingdom 46 62 62 0<br />
18 KYOTO UNIVERSITY Japan 47 70 61 -9<br />
19 UNIVERSITY OF MICHIGAN United States of America 79 96 59 -37<br />
20 PURDUE UNIVERSITY United States of America 50 41 57 16<br />
21 TOHOKU UNIVERSITY Japan 41 51 56 5<br />
22 UNIVERSITY OF UTAH United States of America 59 50 55 5<br />
23 NATIONAL UNIVERSITY OF SINGAPORE Singapore 24 50 54 4<br />
24 POSTECH FOUNDATION Republic of Korea 31 36 50 14<br />
25 NANYANG TECHNOLOGICAL UNIVERSITY Singapore 22 29 49 20<br />
26 STATE UNIVERSITY OF NEW YORK United States of America 32 40 48 8<br />
27 UNIVERSITY OF NORTH CAROLINA United States of America 42 43 47 4<br />
27 KYUSHU UNIVERSITY Japan 27 41 47 6<br />
29 TEL AVIV UNIVERSITY Israel 39 43 46 3<br />
29 UNIVERSITY OF PENNSYLVANIA United States of America 76 64 46 -18<br />
29 WISCONSIN ALUMNI RESEARCH FOUNDATION United States of America 47 46 46 0<br />
29 HANYANG UNIVERSITY Republic of Korea 46 50 46 -4<br />
33 UNIVERSITY OF SOUTHERN CALIFORNIA United States of America 47 38 45 7<br />
33 INDIAN INSTITUTE OF TECHNOLOGY India 8 20 45 25<br />
35 UNIVERSITY OF ILLINOIS United States of America 59 47 44 -3<br />
35 KOREA UNIVERSITY Republic of Korea 27 60 44 -16<br />
35 UNIVERSITY OF COLORADO United States of America 34 47 44 -3<br />
35 OSAKA UNIVERSITY Japan 60 59 44 -15<br />
35 ARIZONA STATE UNIVERSITY United States of America 64 55 44 -11<br />
35 IMPERIAL INNOVATIONS LTD. United Kingdom 37 35 44 9<br />
41 OHIO STATE UNIVERSITY RESEARCH FOUNDATION United States of America 32 30 43 13<br />
41 INDIANA UNIVERSITY United States of America 37 34 43 9<br />
43 HEBREW UNIVERSITY OF JERUSALEM Israel 43 51 41 -10<br />
44 ECOLE POLYTECHNIQUE FEDERALE DE LAUSANNE Switzerland 23 32 40 8<br />
45 DUKE UNIVERSITY United States of America 48 51 39 -12<br />
45 UNIVERSITI SAINS MALAYSIA Malaysia 10 16 39 23<br />
47 TOKYO INSTITUTE OF TECHNOLOGY Japan 26 43 38 -5<br />
49 EMORY UNIVERSITY United States of America 34 25 37 12<br />
49 YALE UNIVERSITY United States of America 24 37 37 0<br />
51 CAMBRIDGE UNIVERSITY United Kingdom 35 40 36 -4<br />
51 DANMARKS TEKNISKE UNIVERSITET Denmark 24 36 36 0<br />
51 NEW YORK UNIVERSITY United States of America 26 34 36 2<br />
Note: The university sector includes applications from all types of educational institutions. Due to confidentiality requirements, <strong>PCT</strong> data are based on<br />
publication date. Top applicants are selected according to the 2012 total.<br />
Source: <strong>WIPO</strong> Statistics Database, March 2013<br />
35