PCT Yearly Review - WIPO
PCT Yearly Review - WIPO
PCT Yearly Review - WIPO
You also want an ePaper? Increase the reach of your titles
YUMPU automatically turns print PDFs into web optimized ePapers that Google loves.
Section A<br />
use of the pct system<br />
A.5<br />
Fields of Technology of<br />
<strong>PCT</strong> Applications<br />
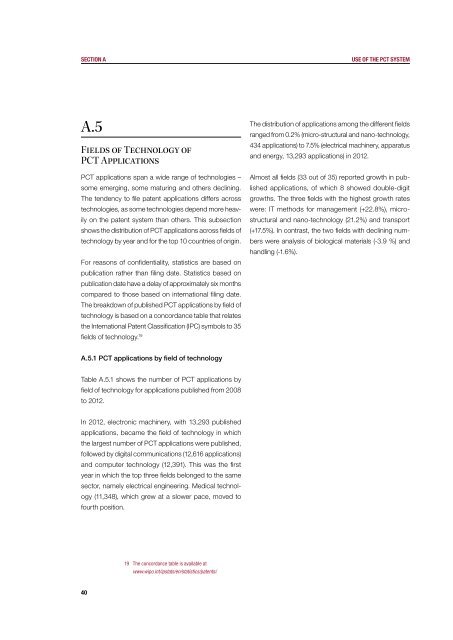
<strong>PCT</strong> applications span a wide range of technologies –<br />
some emerging, some maturing and others declining.<br />
The tendency to file patent applications differs across<br />
technologies, as some technologies depend more heavily<br />
on the patent system than others. This subsection<br />
shows the distribution of <strong>PCT</strong> applications across fields of<br />
technology by year and for the top 10 countries of origin.<br />
For reasons of confidentiality, statistics are based on<br />
publication rather than filing date. Statistics based on<br />
publication date have a delay of approximately six months<br />
compared to those based on international filing date.<br />
The breakdown of published <strong>PCT</strong> applications by field of<br />
technology is based on a concordance table that relates<br />
the International Patent Classification (IPC) symbols to 35<br />
fields of technology. 19<br />
The distribution of applications among the different fields<br />
ranged from 0.2% (micro-structural and nano-technology,<br />
434 applications) to 7.5% (electrical machinery, apparatus<br />
and energy, 13,293 applications) in 2012.<br />
Almost all fields (33 out of 35) reported growth in published<br />
applications, of which 8 showed double-digit<br />
growths. The three fields with the highest growth rates<br />
were: IT methods for management (+22.8%), microstructural<br />
and nano-technology (21.2%) and transport<br />
(+17.5%). In contrast, the two fields with declining numbers<br />
were analysis of biological materials (-3.9 %) and<br />
handling (-1.6%).<br />
A.5.1 <strong>PCT</strong> applications by field of technology<br />
Table A.5.1 shows the number of <strong>PCT</strong> applications by<br />
field of technology for applications published from 2008<br />
to 2012.<br />
In 2012, electronic machinery, with 13,293 published<br />
applications, became the field of technology in which<br />
the largest number of <strong>PCT</strong> applications were published,<br />
followed by digital communications (12,616 applications)<br />
and computer technology (12,391). This was the first<br />
year in which the top three fields belonged to the same<br />
sector, namely electrical engineering. Medical technology<br />
(11,348), which grew at a slower pace, moved to<br />
fourth position.<br />
19 The concordance table is available at<br />
www.wipo.int/ipstats/en/statistics/patents/.<br />
40


