PCT Yearly Review - WIPO
PCT Yearly Review - WIPO
PCT Yearly Review - WIPO

Create successful ePaper yourself
Turn your PDF publications into a flip-book with our unique Google optimized e-Paper software.
Section A<br />
use of the pct system<br />
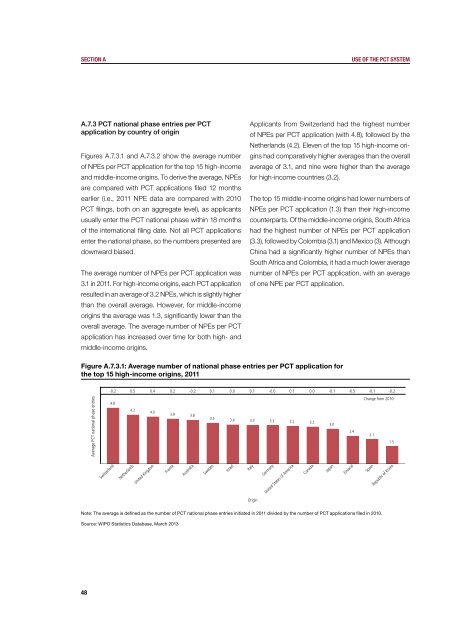
A.7.3 <strong>PCT</strong> national phase entries per <strong>PCT</strong><br />
application by country of origin<br />
Figures A.7.3.1 and A.7.3.2 show the average number<br />
of NPEs per <strong>PCT</strong> application for the top 15 high-income<br />
and middle-income origins. To derive the average, NPEs<br />
are compared with <strong>PCT</strong> applications filed 12 months<br />
earlier (i.e., 2011 NPE data are compared with 2010<br />
<strong>PCT</strong> filings, both on an aggregate level), as applicants<br />
usually enter the <strong>PCT</strong> national phase within 18 months<br />
of the international filing date. Not all <strong>PCT</strong> applications<br />
enter the national phase, so the numbers presented are<br />
downward biased.<br />
The average number of NPEs per <strong>PCT</strong> application was<br />
3.1 in 2011. For high-income origins, each <strong>PCT</strong> application<br />
resulted in an average of 3.2 NPEs, which is slightly higher<br />
than the overall average. However, for middle-income<br />
origins the average was 1.3, significantly lower than the<br />
overall average. The average number of NPEs per <strong>PCT</strong><br />
application has increased over time for both high- and<br />
middle-income origins.<br />
Applicants from Switzerland had the highest number<br />
of NPEs per <strong>PCT</strong> application (with 4.8), followed by the<br />
Netherlands (4.2). Eleven of the top 15 high-income origins<br />
had comparatively higher averages than the overall<br />
average of 3.1, and nine were higher than the average<br />
for high-income countries (3.2).<br />
The top 15 middle-income origins had lower numbers of<br />
NPEs per <strong>PCT</strong> application (1.3) than their high-income<br />
counterparts. Of the middle-income origins, South Africa<br />
had the highest number of NPEs per <strong>PCT</strong> application<br />
(3.3), followed by Colombia (3.1) and Mexico (3). Although<br />
China had a significantly higher number of NPEs than<br />
South Africa and Colombia, it had a much lower average<br />
number of NPEs per <strong>PCT</strong> application, with an average<br />
of one NPE per <strong>PCT</strong> application.<br />
Figure A.7.3.1: Average number of national phase entries per <strong>PCT</strong> application for<br />
the top 15 high-income origins, 2011<br />
Average <strong>PCT</strong> national phase entries<br />
-0.2 0.5 0.4 0.2 -0.2 0.1 0.0 0.1 -0.0 0.1 0.0 -0.1 -0.5 -0.1 -0.2<br />
Change from 2010<br />
4.8<br />
4.2<br />
4.0<br />
3.9 3.8<br />
3.5 3.4 3.3 3.3 3.2 3.2<br />
3.0<br />
2.4<br />
2.1<br />
1.5<br />
Switzerland<br />
Netherlands<br />
United Kingdom<br />
France<br />
Australia<br />
Sweden<br />
Israel<br />
Italy<br />
Germany<br />
United States of America<br />
Canada<br />
Japan<br />
Finland<br />
Spain<br />
Republic of Korea<br />
Origin<br />
Note: The average is defined as the number of <strong>PCT</strong> national phase entries initiated in 2011 divided by the number of <strong>PCT</strong> applications filed in 2010.<br />
Source: <strong>WIPO</strong> Statistics Database, March 2013<br />
48