PCT Yearly Review - WIPO
PCT Yearly Review - WIPO
PCT Yearly Review - WIPO

Create successful ePaper yourself
Turn your PDF publications into a flip-book with our unique Google optimized e-Paper software.
Section A<br />
use of the pct system<br />
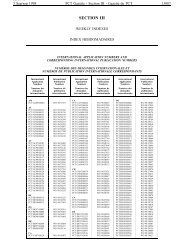
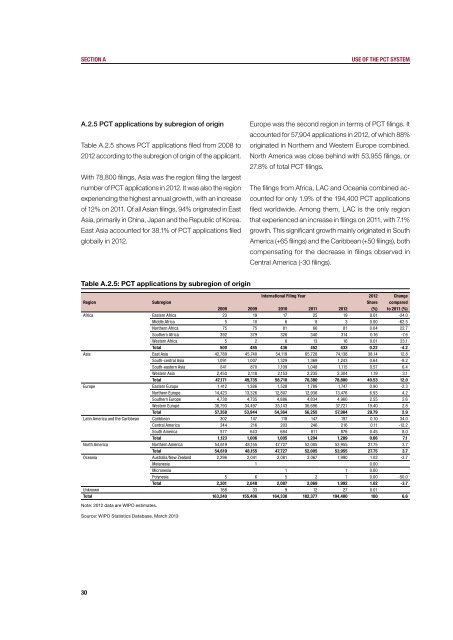
A.2.5 <strong>PCT</strong> applications by subregion of origin<br />
Table A.2.5 shows <strong>PCT</strong> applications filed from 2008 to<br />
2012 according to the subregion of origin of the applicant.<br />
With 78,800 filings, Asia was the region filing the largest<br />
number of <strong>PCT</strong> applications in 2012. It was also the region<br />
experiencing the highest annual growth, with an increase<br />
of 12% on 2011. Of all Asian filings, 94% originated in East<br />
Asia, primarily in China, Japan and the Republic of Korea.<br />
East Asia accounted for 38.1% of <strong>PCT</strong> applications filed<br />
globally in 2012.<br />
Europe was the second region in terms of <strong>PCT</strong> filings. It<br />
accounted for 57,904 applications in 2012, of which 88%<br />
originated in Northern and Western Europe combined.<br />
North America was close behind with 53,955 filings, or<br />
27.8% of total <strong>PCT</strong> filings.<br />
The filings from Africa, LAC and Oceania combined accounted<br />
for only 1.9% of the 194,400 <strong>PCT</strong> applications<br />
filed worldwide. Among them, LAC is the only region<br />
that experienced an increase in filings on 2011, with 7.1%<br />
growth. This significant growth mainly originated in South<br />
America (+65 filings) and the Caribbean (+50 filings), both<br />
compensating for the decrease in filings observed in<br />
Central America (-30 filings).<br />
Table A.2.5: <strong>PCT</strong> applications by subregion of origin<br />
International Filing Year 2012 Change<br />
Region Subregion Share compared<br />
2008 2009 2010 2011 2012 (%) to 2011 (%)<br />
Africa Eastern Africa 23 19 17 25 19 0.01 -24.0<br />
Middle Africa 5 10 6 8 3 0.00 -62.5<br />
Northern Africa 75 75 81 66 81 0.04 22.7<br />
Southern Africa 392 379 326 340 314 0.16 -7.6<br />
Western Africa 5 2 6 13 16 0.01 23.1<br />
Total 500 485 436 452 433 0.22 -4.2<br />
Asia East Asia 42,789 45,740 54,119 65,728 74,138 38.14 12.8<br />
South-central Asia 1,091 1,007 1,329 1,369 1,243 0.64 -9.2<br />
South-eastern Asia 841 870 1,109 1,048 1,115 0.57 6.4<br />
Western Asia 2,450 2,118 2,153 2,235 2,304 1.19 3.1<br />
Total 47,171 49,735 58,710 70,380 78,800 40.53 12.0<br />
Europe Eastern Europe 1,412 1,386 1,528 1,789 1,747 0.90 -2.3<br />
Northern Europe 14,423 13,326 12,807 12,936 13,476 6.93 4.2<br />
Southern Europe 4,730 4,735 4,886 4,834 4,960 2.55 2.6<br />
Western Europe 36,793 34,497 35,143 36,696 37,721 19.40 2.8<br />
Total 57,358 53,944 54,364 56,255 57,904 29.79 2.9<br />
Latin America and the Caribbean Caribbean 302 147 118 147 197 0.10 34.0<br />
Central America 244 216 203 246 216 0.11 -12.2<br />
South America 577 643 684 811 876 0.45 8.0<br />
Total 1,123 1,006 1,005 1,204 1,289 0.66 7.1<br />
North America Northern America 54,619 48,155 47,727 52,005 53,955 27.75 3.7<br />
Total 54,619 48,155 47,727 52,005 53,955 27.75 3.7<br />
Oceania Australia/New Zealand 2,296 2,041 2,081 2,067 1,990 1.02 -3.7<br />
Melanesia 1 0.00<br />
Micronesia 1 1 0.00<br />
Polynesia 5 6 5 2 1 0.00 -50.0<br />
Total 2,301 2,048 2,087 2,069 1,992 1.02 -3.7<br />
Unknown 168 33 9 12 27 0.01<br />
Total 163,240 155,406 164,338 182,377 194,400 100 6.6<br />
Note: 2012 data are <strong>WIPO</strong> estimates.<br />
Source: <strong>WIPO</strong> Statistics Database, March 2013<br />
30