PCT Yearly Review - WIPO
PCT Yearly Review - WIPO
PCT Yearly Review - WIPO

You also want an ePaper? Increase the reach of your titles
YUMPU automatically turns print PDFs into web optimized ePapers that Google loves.
Section A<br />
use of the pct system<br />
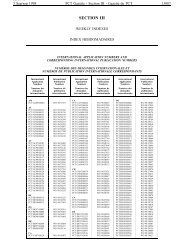
Table A.7.2.2: <strong>PCT</strong> national phase entries for the top five middle-income origins by region<br />
Year of <strong>PCT</strong> national phase entry<br />
Middle-income<br />
Changed<br />
Region Middle-income origin Regional Share compared<br />
2008 2009 2010 2011 2012 (%) in 2011 to 2010 (vol.)<br />
Africa South Africa 817 914 853 804 984 87.9 180<br />
Egypt 62 21 16 12 42 3.8 30<br />
Seychelles 39 14 19 28 41 3.7 13<br />
Morocco 24 10 11 23 16 1.4 -7<br />
Mauritius 19 31 36 8 11 1.0 3<br />
Others 16 23 34 33 26 2.3 -7<br />
Total 977 1,013 969 908 1,120 100.0 212<br />
Asia China 3,784 4,432 5,144 7,723 12,901 75.2 5,178<br />
India 1,922 2,290 1,891 2,570 2,946 17.2 376<br />
Turkey 297 376 353 446 594 3.5 148<br />
Malaysia 94 186 195 252 486 2.8 234<br />
Thailand 23 29 30 51 72 0.4 21<br />
Others 91 115 127 143 165 1.0 22<br />
Total 6,211 7,428 7,740 11,185 17,164 100.0 5,979<br />
Europe Russian Federation 733 925 863 1,001 933 77.8 -68<br />
Ukraine 59 57 53 66 86 7.2 20<br />
Latvia 19 41 86 113 55 4.6 -58<br />
Romania 54 51 22 21 42 3.5 21<br />
Bulgaria 50 57 25 37 36 3.0 -1<br />
Others 75 51 46 94 47 3.9 -47<br />
Total 990 1,182 1,095 1,332 1,199 100.0 -133<br />
Latin America & the Caribbean Brazil 669 721 743 996 1,166 47.6 170<br />
Mexico 319 334 320 448 565 23.1 117<br />
Chile 44 58 50 127 239 9.8 112<br />
Argentina 54 75 91 74 104 4.2 30<br />
Cuba 112 285 104 67 90 3.7 23<br />
Others 154 182 219 222 285 11.6 63<br />
Total 1,352 1,655 1,527 1,934 2,449 100.0 515<br />
Oceania Samoa 2 1 17 5 83.3 -12<br />
Vanuatu 1 4 3 1 16.7 -2<br />
Marshall Islands 1 2 2<br />
Palau 2 -2<br />
Fiji 1<br />
Total 4 6 4 22 6 100.0 -16<br />
Total 9,534 11,284 11,335 15,381 21,938 6,557<br />
Source: <strong>WIPO</strong> Statistics Database, March 2013<br />
In 2011, applicants from middle-income countries initiated<br />
21,938 <strong>PCT</strong> NPEs worldwide, representing 4.3% of all<br />
NPEs initiated worldwide and an increase of 42.6% on<br />
2010. This sharp increase was mainly due to the growth<br />
in filings from China (67%).<br />
In all regions, except LAC, one middle-income country<br />
filed the vast majority of NPEs. For example South Africa<br />
filed 87.9% (or 984 NPEs) of the NPEs initiated by applicants<br />
residing in Africa, and the Russian Federation<br />
accounted for 77.8% (933 NPEs) of those filed by applicants<br />
from European middle-income countries. Brazil and<br />
Mexico each filed significant shares of LAC filings with<br />
47.6% (1,166 NPEs) and 23.1% (565 NPEs), respectively.<br />
47