PCT Yearly Review - WIPO
PCT Yearly Review - WIPO
PCT Yearly Review - WIPO

You also want an ePaper? Increase the reach of your titles
YUMPU automatically turns print PDFs into web optimized ePapers that Google loves.
Section B<br />
performance of the pct system<br />
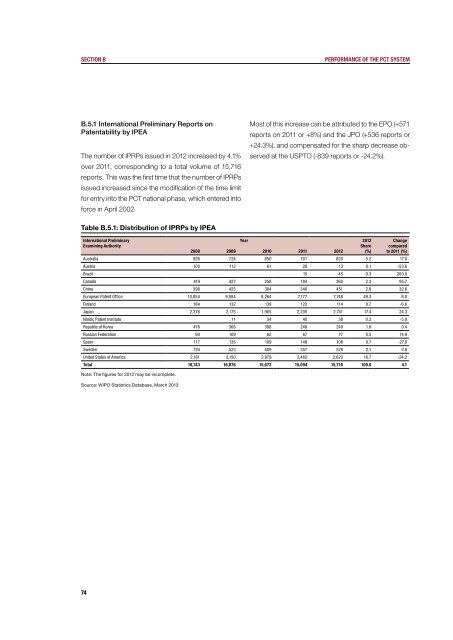
B.5.1 International Preliminary Reports on<br />
Patentability by IPEA<br />
The number of IPRPs issued in 2012 increased by 4.1%<br />
over 2011, corresponding to a total volume of 15,716<br />
reports. This was the first time that the number of IPRPs<br />
issued increased since the modification of the time limit<br />
for entry into the <strong>PCT</strong> national phase, which entered into<br />
force in April 2002.<br />
Most of this increase can be attributed to the EPO (+571<br />
reports on 2011 or +8%) and the JPO (+536 reports or<br />
+24.3%), and compensated for the sharp decrease observed<br />
at the USPTO (-839 reports or -24.2%).<br />
Table B.5.1: Distribution of IPRPs by IPEA<br />
International Preliminary<br />
Examining Authority<br />
Year 2012<br />
Share<br />
Change<br />
compared<br />
2008 2009 2010 2011 2012<br />
(%) to 2011 (%)<br />
Australia 826 724 850 701 820 5.2 17.0<br />
Austria 100 113 61 28 13 0.1 -53.6<br />
Brazil 15 45 0.3 200.0<br />
Canada 419 427 258 184 360 2.3 95.7<br />
China 396 425 394 340 451 2.9 32.6<br />
European Patent Office 10,854 9,584 8,264 7,177 7,748 49.3 8.0<br />
Finland 184 132 139 122 114 0.7 -6.6<br />
Japan 2,376 2,175 1,905 2,205 2,741 17.4 24.3<br />
Nordic Patent Institute 11 34 40 38 0.2 -5.0<br />
Republic of Korea 476 368 308 248 249 1.6 0.4<br />
Russian Federation 90 109 62 67 77 0.5 14.9<br />
Spain 117 135 109 148 108 0.7 -27.0<br />
Sweden 724 523 409 357 329 2.1 -7.8<br />
United States of America 2,181 2,150 2,879 3,462 2,623 16.7 -24.2<br />
Total 18,743 16,876 15,672 15,094 15,716 100.0 4.1<br />
Note: The figures for 2012 may be incomplete.<br />
Source: <strong>WIPO</strong> Statistics Database, March 2013<br />
74