PCT Yearly Review - WIPO
PCT Yearly Review - WIPO
PCT Yearly Review - WIPO

You also want an ePaper? Increase the reach of your titles
YUMPU automatically turns print PDFs into web optimized ePapers that Google loves.
Section A<br />
use of the pct system<br />
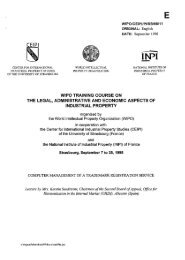
A.3.2 Distribution of <strong>PCT</strong> applications by type of<br />
applicant<br />
The distribution of <strong>PCT</strong> applications for the top 30 origins<br />
broken down by four types of applicant – businesses,<br />
universities, government and research institutions, and<br />
individuals – are presented in Figure A.3.2.<br />
In 2012, business-sector applicants accounted for 83.8%<br />
of published <strong>PCT</strong> applications, followed by individuals,<br />
universities and government and research institutions,<br />
with 8.3%, 5.4% and 2.5% of published applications,<br />
respectively. However, the distribution varied greatly<br />
across origins. Businesses accounted for more than<br />
95% of <strong>PCT</strong> applications belonging to residents of Japan,<br />
Finland and Sweden. By contrast, the business sector<br />
accounted for about a third of <strong>PCT</strong> applications filed by<br />
applicants from the Russian Federation and a quarter of<br />
those filed by applicants from Malaysia.<br />
Individuals accounted for a majority (63%) of applications<br />
originating in the Russian Federation. Universities<br />
accounted for a large share of applications for Malaysia<br />
(19.7%), Singapore (18.9%) and Spain (17.6%), whereas<br />
government and research institutions represented a high<br />
share of <strong>PCT</strong> applications originating in Malaysia (45%),<br />
Singapore (17%) and France (11.2%).<br />
Figure A.3.2: Distribution of <strong>PCT</strong> applications by type of applicant for top 30 origins, 2012<br />
Business Individual University Government/Research<br />
Distribution of <strong>PCT</strong> applications (%)<br />
100<br />
75<br />
50<br />
25<br />
0<br />
95.7 95.4 95.4 91.5 91.4 90.8 89.6 87.8 83.9 82.7 81.9 80.5 78.3 77.9 77.4<br />
Business sector share (%)<br />
Japan<br />
Finland<br />
Sweden<br />
Netherlands<br />
Switzerland<br />
Germany<br />
Denmark<br />
Norway<br />
Belgium<br />
Origin<br />
United States of America<br />
Austria<br />
France<br />
China<br />
United Kingdom<br />
Italy<br />
Distribution of <strong>PCT</strong> applications (%)<br />
100<br />
75<br />
50<br />
25<br />
0<br />
Business Individual University Government/Research<br />
73.9 72.6 71.5 68.4 67.5 66.8 64.4 60.0 56.5 54.7 47.0 41.2 37.9 33.5 24.7<br />
Business sector share (%)<br />
Canada<br />
New Zealand<br />
Ireland<br />
Australia<br />
Republic of Korea<br />
Israel<br />
Turkey<br />
Origin<br />
India<br />
Spain<br />
Singapore<br />
Brazil<br />
South Africa<br />
Mexico<br />
Russian Federation<br />
Malaysia<br />
Note: Government and research institutions include private non-profit organizations and hospitals. The university sector includes all educational institutions.<br />
Due to confidentiality requirements, <strong>PCT</strong> data are based on publication date.<br />
Source: <strong>WIPO</strong> Statistics Database, March 2013<br />
33