Basics of Light Microscopy Imaging - AOMF
Basics of Light Microscopy Imaging - AOMF
Basics of Light Microscopy Imaging - AOMF

Create successful ePaper yourself
Turn your PDF publications into a flip-book with our unique Google optimized e-Paper software.
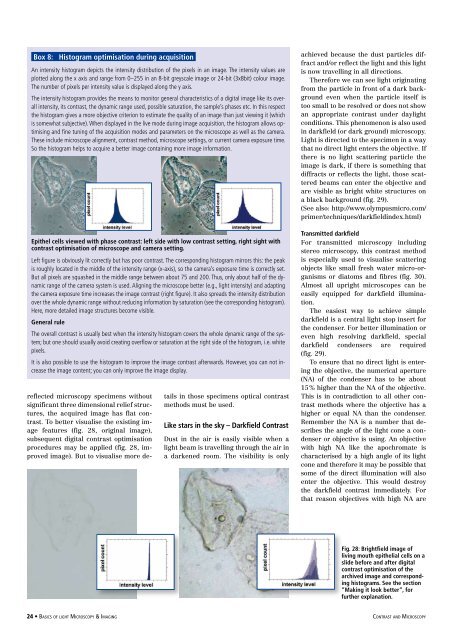
Box 8: Histogram optimisation during acquisition<br />
An intensity histogram depicts the intensity distribution <strong>of</strong> the pixels in an image. The intensity values are<br />
plotted along the x axis and range from 0–255 in an 8-bit greyscale image or 24-bit (3x8bit) colour image.<br />
The number <strong>of</strong> pixels per intensity value is displayed along the y axis.<br />
The intensity histogram provides the means to monitor general characteristics <strong>of</strong> a digital image like its overall<br />
intensity, its contrast, the dynamic range used, possible saturation, the sample’s phases etc. In this respect<br />
the histogram gives a more objective criterion to estimate the quality <strong>of</strong> an image than just viewing it (which<br />
is somewhat subjective). When displayed in the live mode during image acquisition, the histogram allows optimising<br />
and fine tuning <strong>of</strong> the acquisition modes and parameters on the microscope as well as the camera.<br />
These include microscope alignment, contrast method, microscope settings, or current camera exposure time.<br />
So the histogram helps to acquire a better image containing more image information.<br />
Epithel cells viewed with phase contrast: left side with low contrast setting, right sight with<br />
contrast optimisation <strong>of</strong> microscope and camera setting.<br />
Left figure is obviously lit correctly but has poor contrast. The corresponding histogram mirrors this: the peak<br />
is roughly located in the middle <strong>of</strong> the intensity range (x-axis), so the camera’s exposure time is correctly set.<br />
But all pixels are squashed in the middle range between about 75 and 200. Thus, only about half <strong>of</strong> the dynamic<br />
range <strong>of</strong> the camera system is used. Aligning the microscope better (e.g., light intensity) and adapting<br />
the camera exposure time increases the image contrast (right figure). It also spreads the intensity distribution<br />
over the whole dynamic range without reducing information by saturation (see the corresponding histogram).<br />
Here, more detailed image structures become visible.<br />
General rule<br />
The overall contrast is usually best when the intensity histogram covers the whole dynamic range <strong>of</strong> the system;<br />
but one should usually avoid creating overflow or saturation at the right side <strong>of</strong> the histogram, i.e. white<br />
pixels.<br />
It is also possible to use the histogram to improve the image contrast afterwards. However, you can not increase<br />
the image content; you can only improve the image display.<br />
reflected microscopy specimens without<br />
significant three dimensional relief structures,<br />
the acquired image has flat contrast.<br />
To better visualise the existing image<br />
features (fig. 28, original image),<br />
subsequent digital contrast optimisation<br />
procedures may be applied (fig. 28, improved<br />
image). But to visualise more details<br />
in those specimens optical contrast<br />
methods must be used.<br />
Like stars in the sky – Darkfield Contrast<br />
Dust in the air is easily visible when a<br />
light beam is travelling through the air in<br />
a darkened room. The visibility is only<br />
achieved because the dust particles diffract<br />
and/or reflect the light and this light<br />
is now travelling in all directions.<br />
Therefore we can see light originating<br />
from the particle in front <strong>of</strong> a dark background<br />
even when the particle itself is<br />
too small to be resolved or does not show<br />
an appropriate contrast under daylight<br />
conditions. This phenomenon is also used<br />
in darkfield (or dark ground) microscopy.<br />
<strong>Light</strong> is directed to the specimen in a way<br />
that no direct light enters the objective. If<br />
there is no light scattering particle the<br />
image is dark, if there is something that<br />
diffracts or reflects the light, those scattered<br />
beams can enter the objective and<br />
are visible as bright white structures on<br />
a black background (fig. 29).<br />
(See also: http://www.olympusmicro.com/<br />
primer/techniques/darkfieldindex.html)<br />
Transmitted darkfield<br />
For transmitted microscopy including<br />
stereo microscopy, this contrast method<br />
is especially used to visualise scattering<br />
objects like small fresh water micro-organisms<br />
or diatoms and fibres (fig. 30).<br />
Almost all upright microscopes can be<br />
easily equipped for darkfield illumination.<br />
The easiest way to achieve simple<br />
darkfield is a central light stop insert for<br />
the condenser. For better illumination or<br />
even high resolving darkfield, special<br />
darkfield condensers are required<br />
(fig. 29).<br />
To ensure that no direct light is entering<br />
the objective, the numerical aperture<br />
(NA) <strong>of</strong> the condenser has to be about<br />
15 % higher than the NA <strong>of</strong> the objective.<br />
This is in contradiction to all other contrast<br />
methods where the objective has a<br />
higher or equal NA than the condenser.<br />
Remember the NA is a number that describes<br />
the angle <strong>of</strong> the light cone a condenser<br />
or objective is using. An objective<br />
with high NA like the apochromate is<br />
characterised by a high angle <strong>of</strong> its light<br />
cone and therefore it may be possible that<br />
some <strong>of</strong> the direct illumination will also<br />
enter the objective. This would destroy<br />
the darkfield contrast immediately. For<br />
that reason objectives with high NA are<br />
Fig. 28: Brightfield image <strong>of</strong><br />
living mouth epithelial cells on a<br />
slide before and after digital<br />
contrast optimisation <strong>of</strong> the<br />
archived image and corresponding<br />
histograms. See the section<br />
“Making it look better“, for<br />
further explanation.<br />
24 • <strong>Basics</strong> <strong>of</strong> light <strong>Microscopy</strong> & <strong>Imaging</strong> contrast and <strong>Microscopy</strong>