Basics of Light Microscopy Imaging - AOMF
Basics of Light Microscopy Imaging - AOMF
Basics of Light Microscopy Imaging - AOMF

Create successful ePaper yourself
Turn your PDF publications into a flip-book with our unique Google optimized e-Paper software.
etween two different fluorophores. The<br />
first fluorophore (the donor) is excited by<br />
light. The donor transfers its energy to the<br />
second fluorophore (the acceptor) without<br />
radiation, meaning without any emission<br />
<strong>of</strong> photons. As a result, the acceptor is excited<br />
by the donor and shows fluorescence<br />
(“sensitised emission”). The donor is<br />
quenched and does not show any fluorescence.<br />
This radiation-free energy transfer<br />
occurs within the very limited range <strong>of</strong> 1–<br />
10 nm distances between the donor and<br />
the acceptor. A positive FRET signal provides<br />
information about the distance between<br />
the FRET partners and can be<br />
quantified as FRET efficiency. When no<br />
FRET signal is achieved, there may be<br />
many reasons for that: e.g. too much distance<br />
between the FRET partners, insufficient<br />
steric orientation, insufficient dipole<br />
orientation, insufficient spectral<br />
overlap between the emission spectrum <strong>of</strong><br />
the donor and the excitation spectrum <strong>of</strong><br />
the acceptor. See box 15.<br />
How long does a fluorochrome live –<br />
count the photons!<br />
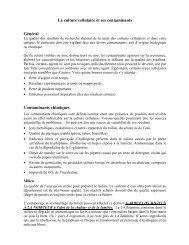
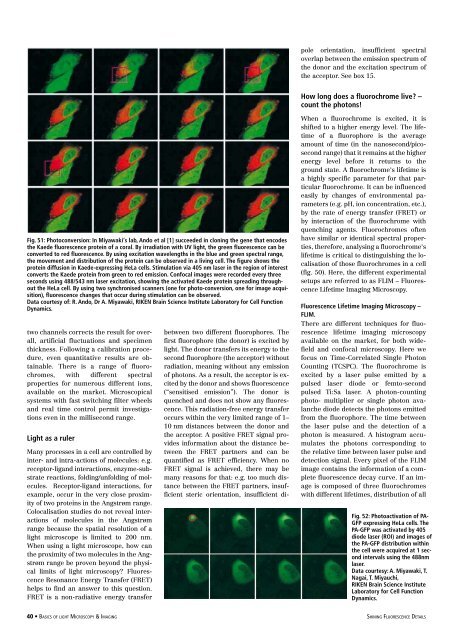
Fig. 51: Photoconversion: In Miyawaki‘s lab, Ando et al [1] succeeded in cloning the gene that encodes<br />
the Kaede fluorescence protein <strong>of</strong> a coral. By irradiation with UV light, the green fluorescence can be<br />
converted to red fluorescence. By using excitation wavelengths in the blue and green spectral range,<br />
the movement and distribution <strong>of</strong> the protein can be observed in a living cell. The figure shows the<br />
protein diffusion in Kaede-expressing HeLa cells. Stimulation via 405 nm laser in the region <strong>of</strong> interest<br />
converts the Kaede protein from green to red emission. Confocal images were recorded every three<br />
seconds using 488/543 nm laser excitation, showing the activated Kaede protein spreading throughout<br />
the HeLa cell. By using two synchronised scanners (one for photo-conversion, one for image acquisition),<br />
fluorescence changes that occur during stimulation can be observed.<br />
Data courtesy <strong>of</strong>: R. Ando, Dr A. Miyawaki, RIKEN Brain Science Institute Laboratory for Cell Function<br />
Dynamics.<br />
two channels corrects the result for overall,<br />
artificial fluctuations and specimen<br />
thickness. Following a calibration procedure,<br />
even quantitative results are obtainable.<br />
There is a range <strong>of</strong> fluorochromes,<br />
with different spectral<br />
properties for numerous different ions,<br />
available on the market. Microscopical<br />
systems with fast switching filter wheels<br />
and real time control permit investigations<br />
even in the millisecond range.<br />
<strong>Light</strong> as a ruler<br />
Many processes in a cell are controlled by<br />
inter- and intra-actions <strong>of</strong> molecules: e.g.<br />
receptor-ligand interactions, enzyme-substrate<br />
reactions, folding/unfolding <strong>of</strong> molecules.<br />
Receptor-ligand interactions, for<br />
example, occur in the very close proximity<br />
<strong>of</strong> two proteins in the Angstrøm range.<br />
Colocalisation studies do not reveal interactions<br />
<strong>of</strong> molecules in the Angstrøm<br />
range because the spatial resolution <strong>of</strong> a<br />
light microscope is limited to 200 nm.<br />
When using a light microscope, how can<br />
the proximity <strong>of</strong> two molecules in the Angstrøm<br />
range be proven beyond the physical<br />
limits <strong>of</strong> light microscopy Fluorescence<br />
Resonance Energy Transfer (FRET)<br />
helps to find an answer to this question.<br />
FRET is a non-radiative energy transfer<br />
When a fluorochrome is excited, it is<br />
shifted to a higher energy level. The lifetime<br />
<strong>of</strong> a fluorophore is the average<br />
amount <strong>of</strong> time (in the nanosecond/picosecond<br />
range) that it remains at the higher<br />
energy level before it returns to the<br />
ground state. A fluorochrome‘s lifetime is<br />
a highly specific parameter for that particular<br />
fluorochrome. It can be influenced<br />
easily by changes <strong>of</strong> environmental parameters<br />
(e.g. pH, ion concentration, etc.),<br />
by the rate <strong>of</strong> energy transfer (FRET) or<br />
by interaction <strong>of</strong> the fluorochrome with<br />
quenching agents. Fluorochromes <strong>of</strong>ten<br />
have similar or identical spectral properties,<br />
therefore, analysing a fluorochrome‘s<br />
lifetime is critical to distinguishing the localisation<br />
<strong>of</strong> those fluorochromes in a cell<br />
(fig. 50). Here, the different experimental<br />
setups are referred to as FLIM – Fluorescence<br />
Lifetime <strong>Imaging</strong> <strong>Microscopy</strong>.<br />
Fluorescence Lifetime <strong>Imaging</strong> <strong>Microscopy</strong> –<br />
FLIM.<br />
There are different techniques for fluorescence<br />
lifetime imaging microscopy<br />
available on the market, for both widefield<br />
and confocal microscopy. Here we<br />
focus on Time-Correlated Single Photon<br />
Counting (TCSPC). The fluorochrome is<br />
excited by a laser pulse emitted by a<br />
pulsed laser diode or femto-second<br />
pulsed Ti:Sa laser. A photon-counting<br />
photo- multiplier or single photon avalanche<br />
diode detects the photons emitted<br />
from the fluorophore. The time between<br />
the laser pulse and the detection <strong>of</strong> a<br />
photon is measured. A histogram accumulates<br />
the photons corresponding to<br />
the relative time between laser pulse and<br />
detection signal. Every pixel <strong>of</strong> the FLIM<br />
image contains the information <strong>of</strong> a complete<br />
fluorescence decay curve. If an image<br />
is composed <strong>of</strong> three fluorochromes<br />
with different lifetimes, distribution <strong>of</strong> all<br />
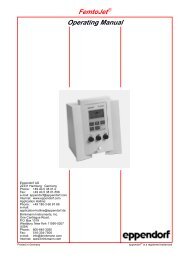
Fig. 52: Photoactivation <strong>of</strong> PA-<br />
GFP expressing HeLa cells. The<br />
PA-GFP was activated by 405<br />
diode laser (ROI) and images <strong>of</strong><br />
the PA-GFP distribution within<br />
the cell were acquired at 1 second<br />
intervals using the 488nm<br />
laser.<br />
Data courtesy: A. Miyawaki, T.<br />
Nagai, T. Miyauchi,<br />
RIKEN Brain Science Institute<br />
Laboratory for Cell Function<br />
Dynamics.<br />
40 • <strong>Basics</strong> <strong>of</strong> light <strong>Microscopy</strong> & <strong>Imaging</strong> shining Fluorescence Details