Basics of Light Microscopy Imaging - AOMF
Basics of Light Microscopy Imaging - AOMF
Basics of Light Microscopy Imaging - AOMF

You also want an ePaper? Increase the reach of your titles
YUMPU automatically turns print PDFs into web optimized ePapers that Google loves.
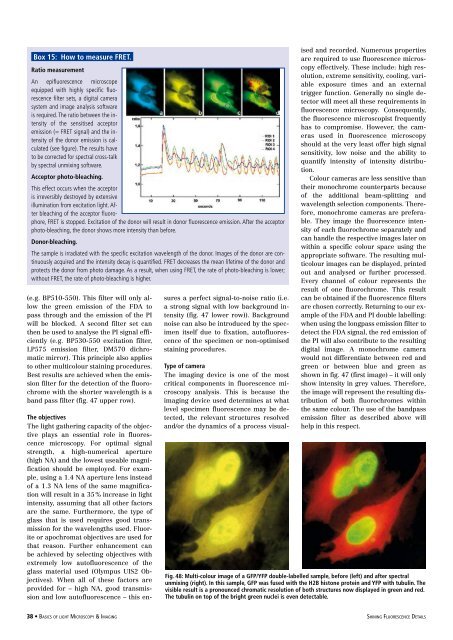
Box 15: How to measure FRET.<br />
Ratio measurement<br />
An epifluorescence microscope<br />
equipped with highly specific fluorescence<br />
filter sets, a digital camera<br />
system and image analysis s<strong>of</strong>tware<br />
is required. The ratio between the intensity<br />
<strong>of</strong> the sensitised acceptor<br />
emission (= FRET signal) and the intensity<br />
<strong>of</strong> the donor emission is calculated<br />
(see figure). The results have<br />
to be corrected for spectral cross-talk<br />
by spectral unmixing s<strong>of</strong>tware.<br />
Acceptor photo-bleaching.<br />
This effect occurs when the acceptor<br />
is irreversibly destroyed by extensive<br />
illumination from excitation light. After<br />
bleaching <strong>of</strong> the acceptor fluorophore,<br />
FRET is stopped. Excitation <strong>of</strong> the donor will result in donor fluorescence emission. After the acceptor<br />
photo-bleaching, the donor shows more intensity than before.<br />
Donor-bleaching.<br />
The sample is irradiated with the specific excitation wavelength <strong>of</strong> the donor. Images <strong>of</strong> the donor are continuously<br />
acquired and the intensity decay is quantified. FRET decreases the mean lifetime <strong>of</strong> the donor and<br />
protects the donor from photo damage. As a result, when using FRET, the rate <strong>of</strong> photo-bleaching is lower;<br />
without FRET, the rate <strong>of</strong> photo-bleaching is higher.<br />
(e.g. BP510-550). This filter will only allow<br />
the green emission <strong>of</strong> the FDA to<br />
pass through and the emission <strong>of</strong> the PI<br />
will be blocked. A second filter set can<br />
then be used to analyse the PI signal efficiently<br />
(e.g. BP530-550 excitation filter,<br />
LP575 emission filter, DM570 dichromatic<br />
mirror). This principle also applies<br />
to other multicolour staining procedures.<br />
Best results are achieved when the emission<br />
filter for the detection <strong>of</strong> the fluorochrome<br />
with the shorter wavelength is a<br />
band pass filter (fig. 47 upper row).<br />
The objectives<br />
The light gathering capacity <strong>of</strong> the objective<br />
plays an essential role in fluorescence<br />
microscopy. For optimal signal<br />
strength, a high-numerical aperture<br />
(high NA) and the lowest useable magnification<br />
should be employed. For example,<br />
using a 1.4 NA aperture lens instead<br />
<strong>of</strong> a 1.3 NA lens <strong>of</strong> the same magnification<br />
will result in a 35 % increase in light<br />
intensity, assuming that all other factors<br />
are the same. Furthermore, the type <strong>of</strong><br />
glass that is used requires good transmission<br />
for the wavelengths used. Fluorite<br />
or apochromat objectives are used for<br />
that reason. Further enhancement can<br />
be achieved by selecting objectives with<br />
extremely low aut<strong>of</strong>luorescence <strong>of</strong> the<br />
glass material used (Olympus UIS2 Objectives).<br />
When all <strong>of</strong> these factors are<br />
provided for – high NA, good transmission<br />
and low aut<strong>of</strong>luorescence – this ensures<br />
a perfect signal-to-noise ratio (i.e.<br />
a strong signal with low background intensity<br />
(fig. 47 lower row)). Background<br />
noise can also be introduced by the specimen<br />
itself due to fixation, aut<strong>of</strong>luorescence<br />
<strong>of</strong> the specimen or non-optimised<br />
staining procedures.<br />
Type <strong>of</strong> camera<br />
The imaging device is one <strong>of</strong> the most<br />
critical components in fluorescence microscopy<br />
analysis. This is because the<br />
imaging device used determines at what<br />
level specimen fluorescence may be detected,<br />
the relevant structures resolved<br />
and/or the dynamics <strong>of</strong> a process visualised<br />
and recorded. Numerous properties<br />
are required to use fluorescence microscopy<br />
effectively. These include: high resolution,<br />
extreme sensitivity, cooling, variable<br />
exposure times and an external<br />
trigger function. Generally no single detector<br />
will meet all these requirements in<br />
fluorescence microscopy. Consequently,<br />
the fluorescence microscopist frequently<br />
has to compromise. However, the cameras<br />
used in fluorescence microscopy<br />
should at the very least <strong>of</strong>fer high signal<br />
sensitivity, low noise and the ability to<br />
quantify intensity <strong>of</strong> intensity distribution.<br />
Colour cameras are less sensitive than<br />
their monochrome counterparts because<br />
<strong>of</strong> the additional beam-splitting and<br />
wavelength selection components. Therefore,<br />
monochrome cameras are preferable.<br />
They image the fluorescence intensity<br />
<strong>of</strong> each fluorochrome separately and<br />
can handle the respective images later on<br />
within a specific colour space using the<br />
appropriate s<strong>of</strong>tware. The resulting multicolour<br />
images can be displayed, printed<br />
out and analysed or further processed.<br />
Every channel <strong>of</strong> colour represents the<br />
result <strong>of</strong> one fluorochrome. This result<br />
can be obtained if the fluorescence filters<br />
are chosen correctly. Returning to our example<br />
<strong>of</strong> the FDA and PI double labelling:<br />
when using the longpass emission filter to<br />
detect the FDA signal, the red emission <strong>of</strong><br />
the PI will also contribute to the resulting<br />
digital image. A monochrome camera<br />
would not differentiate between red and<br />
green or between blue and green as<br />
shown in fig. 47 (first image) – it will only<br />
show intensity in grey values. Therefore,<br />
the image will represent the resulting distribution<br />
<strong>of</strong> both fluorochromes within<br />
the same colour. The use <strong>of</strong> the bandpass<br />
emission filter as described above will<br />
help in this respect.<br />
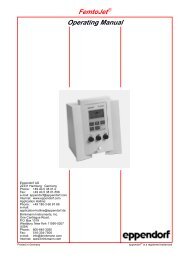
Fig. 48: Multi-colour image <strong>of</strong> a GFP/YFP double-labelled sample, before (left) and after spectral<br />
unmixing (right). In this sample, GFP was fused with the H2B histone protein and YFP with tubulin. The<br />
visible result is a pronounced chromatic resolution <strong>of</strong> both structures now displayed in green and red.<br />
The tubulin on top <strong>of</strong> the bright green nuclei is even detectable.<br />
38 • <strong>Basics</strong> <strong>of</strong> light <strong>Microscopy</strong> & <strong>Imaging</strong> shining Fluorescence Details