2010-11 - Grasim
2010-11 - Grasim
2010-11 - Grasim

Create successful ePaper yourself
Turn your PDF publications into a flip-book with our unique Google optimized e-Paper software.
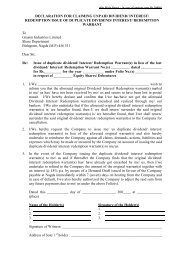
ULTRATECH CEMENT LANKA (PVT) LIMITED<br />
16 PROPER<br />
OPERTY<br />
TY, , PLANT AND EQUIPMENT<br />
PROPER<br />
OPERTY<br />
TY, , PLANT & EQUIPMENT<br />
Plant &<br />
Office<br />
fice<br />
Buildings<br />
machiner<br />
hinery<br />
equipment<br />
SLR<br />
SLR<br />
SLR<br />
Lab<br />
Computer<br />
equipment<br />
equipment<br />
SLR<br />
SLR<br />
Electrical<br />
HT T power<br />
er<br />
installation<br />
line<br />
SLR<br />
SLR<br />
Furnit<br />
urnitures<br />
ures<br />
Motor<br />
& fittings<br />
tings<br />
vehicles<br />
SLR.<br />
SLR<br />
Motor<br />
Capital<br />
al<br />
Tot<br />
otal<br />
al<br />
cycles<br />
cles<br />
work in<br />
SLR<br />
SLR<br />
progress<br />
SLR<br />
Cost<br />
Balance as at 01-04-20<br />
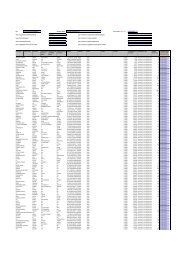
-04-<strong>2010</strong> 53,087,233 489,853,145 4,295,469 4,334,698 <strong>11</strong>,470,028 71,932,840 1,167,013 1,492,355 4,601,668 2,947,120 - 645,181,568<br />
Additions - - 398,767 - 138,965 - - - 33,380,719 1,480,999 1,005,156 36,404,606<br />
Disposals (Note 16.1) - (7,830,619) (133,674) - (64,135) - - - - (527,338) - (8,555,767)<br />
Balance as at 31-03-20<br />
-03-20<strong>11</strong> 53,087,233<br />
,233 482,022,526 4,560,561 4,334,698 <strong>11</strong>,544,858<br />
1,544,858 71,932,840 1,167<br />
67,0<br />
,013 1,492,355 37,982,387<br />
3,900,781<br />
0,781 1,005,1<br />
05,156<br />
56 673,030,407<br />
Depreciation<br />
Balance as at 01-04-20<br />
-04-<strong>2010</strong> 14,677,316 188,916,301 3,347,470 2,537,938 9,674,715 27,707,581 498,634 1,172,846 3,350,816 2,019,722 - 253,903,339<br />
Charge for the year 2,319,444 33,375,124 366,165 382,557 785,480 4,015,153 66,838 85,775 2,194,904 369,588 - 43,961,028<br />
Disposals (Note 16.1) - (3,502,639) (133,674) - (30,777) - - - - (527,337) - (4,194,427)<br />
Balance as at 31-03-20<br />
-03-20<strong>11</strong> 16,996,7<br />
6,996,760<br />
60 218,788,786<br />
3,579,961 2,920,495 10,429,41<br />
0,429,418 31,722,734 565,472 1,258,621 5,545,720 1,861,973 - 293,669,940<br />
Carrying amount<br />
As at 31-03-20<br />
-03-20<strong>11</strong> 36,090,473 263,233,740<br />
980,600 1,414,203 1,<strong>11</strong>5,440<br />
40,210,1<br />
0,106<br />
06 601,541<br />
233,734 32,436,667 2,038,808 1,005,1<br />
05,156<br />
56 379,360,468<br />
As at 31-03-<strong>2010</strong> 38,409,917 300,936,844 947,999 1,796,760 1,795,313 44,225,259 668,379 319,509 1,250,852 927,398 - 391,278,230<br />
Note 16.1 : Disposals of Plant and Machineries include Rs.4.3Mn worth of discarded assets that were fully written off to the income statement.<br />
PROPER<br />
OPERTY<br />
TY, , PLANT & EQUIPMENT<br />
Plant &<br />
Office<br />
fice<br />
Lab<br />
Computer<br />
Electrical<br />
HT power<br />
Furnit<br />
urniture ure &<br />
Motor<br />
Motor<br />
Capital<br />
al<br />
Tot<br />
otal<br />
Buildings<br />
machiner<br />
hinery<br />
equipments<br />
equipments equipments<br />
installation<br />
line<br />
fittings<br />
tings<br />
vehicles<br />
Cycles<br />
work in<br />
INR<br />
INR<br />
INR<br />
INR<br />
INR<br />
INR<br />
INR<br />
INR<br />
INR<br />
INR<br />
INR<br />
Progress<br />
INR<br />
Cost<br />
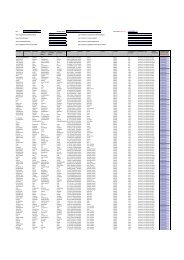
Balance as at 01-04-<strong>2010</strong> 21,444,069 197,871,386 1,735,<strong>11</strong>3 1,750,959 4,633,206 29,056,567 471,403 602,822 1,858,799 1,190,460 - 260,614,783<br />
Additions - - 161,078 - 56,134 - - - 13,483,815 598,235 406,023 14,705,284<br />
Disposals - (3,163,102) (53,996) - (25,907) - - - - (213,013) - (3,456,018)<br />
Balance as at 31-03-20<strong>11</strong> 21,444,069 194,708,284<br />
1,842,194<br />
1,750,959 4,663,432 29,056,567 471,403 602,822 15,342,614 1,575,682 406,023 271,864,049<br />
Depreciation<br />
Balance as at 01-04-<strong>2010</strong> 5,928,758 76,310,892 1,352,178 1,025,175 3,908,006 <strong>11</strong>,192,206 201,418 473,760 1,353,529 815,847 - 102,561,770<br />
Charge for the year 936,917 13,481,555 147,909 154,530 317,287 1,621,882 26,999 34,648 886,610 149,292- 17,757,628<br />
Disposals - (1,414,857) (53,996) - (12,432) - - - - (213,013) - (1,694,298)<br />
Balance as at 31-03-20<strong>11</strong> 6,865,675 88,377,590<br />
,590 1,446,090 1,179,705<br />
4,212,861 12,814,088 228,417 508,408 2,240,139 752,127 - <strong>11</strong>8,625,1<br />
8,625,100<br />
Written down value<br />
As at 31-03-20<strong>11</strong> 14,578,394<br />
4,578,394106,330,694<br />
396,104<br />
571,253 450,571 16,242,479<br />
242,987 94,415 13,1<br />
3,102,47<br />
02,474 823,555 406,023 153,238,950<br />
As at 31-03-<strong>2010</strong> 15,128,<strong>11</strong>7 <strong>11</strong>8,526,880 373,378 707,671 707,101 17,418,545 263,248 125,842 492,660 365,265 154,108,706<br />
Note 16.1 : Disposals of Plant and Machineries include Rs.1.7 Mn worth of discarded assets that were fully written off to the income statement.<br />
17 INVENTORIES<br />
20<strong>11</strong> <strong>2010</strong><br />
SLR<br />
INR SLR INR<br />
Naked cement 58,556,170<br />
70 23,653,192<br />
92 18,292,496 7,204,676<br />
Bags 1,870,775 755,681 2,312,147 910,661<br />
Stores and spares 18,937<br />
8,937,079<br />
,079 7,649,448<br />
16,761,857 6,601,819<br />
Goods-in-transit <strong>11</strong>3,222,57<br />
3,222,574 45,735,151 126,642,075 49,879,203<br />
192,586,598<br />
77,793,472<br />
164,008,575 64,596,360<br />
125 ⊳