2010-11 - Grasim
2010-11 - Grasim
2010-11 - Grasim

Create successful ePaper yourself
Turn your PDF publications into a flip-book with our unique Google optimized e-Paper software.
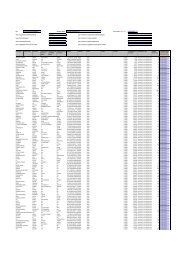
ULTRATECH CEMENT<br />
MIDDLE EAST INVESTMENTS LIMITED<br />
SCHEDULE 5: FIXED ASSE<br />
SSETS<br />
Amount in AED Crores<br />
Particulars<br />
Gross Block<br />
Depreciation<br />
Net Block<br />
As at Acquired Additions Deductions/ As at As at Additions For the Deductions/ As at<br />
As at<br />
April 01, from ETA Adjustments Mar 31, April 01, year Adjustments Mar 31, Mar 31,<br />
<strong>2010</strong> 20<strong>11</strong> <strong>2010</strong> 20<strong>11</strong> 20<strong>11</strong><br />
(A)<br />
(B)<br />
Tangible<br />
Assets<br />
Freehold Land 0.00 0.51 0.00 (0.01) 0.50 0.00 0.00 0.00 0.00 0.00 0.50<br />
Buildings 0.00 3.49 0.01 (0.04) 3.46 0.00 1.08 0.14 (0.00) 1.22 2.24<br />
Plant and Machinery 0.00 79.12 0.06 (0.39) 78.80 0.00 <strong>11</strong>.72 3.36 (0.05) 15.03 63.77<br />
Furniture and Fixtures 0.00 0.91 0.28 (0.01) 1.18 0.00 0.77 0.08 (0.00) 0.84 0.34<br />
Vehicles 0.00 0.32 0.05 (0.00) 0.36 0.00 0.24 0.03 (0.00) 0.27 0.09<br />
Tot<br />
otal<br />
Tangible<br />
Assets<br />
0.00 84.35 0.40 (0.45) 84.30 0.00 13.81<br />
3.61 (0.05) 17.36<br />
66.94<br />
Intangible<br />
Assets<br />
Intangible Asset 0.00 0.82 0.00 0.00 0.82 0.00 0.65 0.06 0.00 0.71 0.12<br />
Tot<br />
otal<br />
Assets (A+B) 0.00 85.18 0.40 (0.45) 85.13 0.00 14.46<br />
3.66 (0.05) 18.07<br />
67.06<br />
Previous year<br />
Add: Capital<br />
al<br />
Work-in-P<br />
ork-in-Progress<br />
rogress 1.66<br />
3.24 0.00 4.91 0.00 4.91<br />
71.96<br />
Notes :<br />
Depreciation for the year 3.66<br />
Add: Obsolescence 0.00<br />
Less: Depreciation transferred<br />
to Pre-operative Expenses 0.00<br />
Depreciation as per Profit and Loss Account 3.66<br />
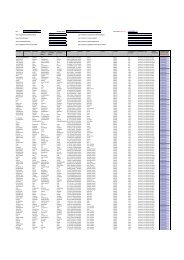
SCHEDULE 5: FIXED ASSE<br />
SSETS<br />
Amount in INR Crores<br />
Particulars<br />
Gross Block<br />
Depreciation<br />
Net Block<br />
As at Acquired Additions Deductions/ As at As at Additions For the Deductions/ As at<br />
As at<br />
April 01, from ETA Adjustments Mar 31, April 01, year Adjustments Mar 31, Mar 31,<br />
<strong>2010</strong> 20<strong>11</strong> <strong>2010</strong> 20<strong>11</strong> 20<strong>11</strong><br />
(A)<br />
(B)<br />
Tangible<br />
Assets<br />
Freehold Land 0.00 6.37 0.00 (0.30) 6.07 0.00 0.00 0.00 0.00 0.00 6.07<br />
Buildings 0.00 43.29 0.13 (1.43) 41.99 0.00 13.37 1.78 (0.35) 14.80 27.1<br />
.19<br />
Plant and Machinery 0.00 981.41 0.78 (25.37) 956.82 0.00 145.38 41.66 (4.51) 182.53 774.29<br />
Furniture and Fixtures 0.00 <strong>11</strong>.25 3.47 (0.39) 14.33 0.00 9.52 0.95 (0.25) 10.22 4.<strong>11</strong><br />
Vehicles 0.00 3.92 0.64 (0.15) 4.41 0.00 3.01 0.34 (0.09) 3.26 1.1<br />
.15<br />
Tot<br />
otal<br />
al Tangible<br />
Assets<br />
0.00 1,046.24 5.02 (27.64)<br />
1,023.62 0.00 171<br />
71.28<br />
44.73 (5.20) 210.81<br />
812.81<br />
Intangible<br />
Assets<br />
Intangible Asset 0.00 10.23 0.00 0.21 10.02 0.00 8.08 0.69 (0.18) 8.59 1.43<br />
Tot<br />
otal<br />
al Assets (A+B) 0.00 1,056.47 5.02 (27.85)<br />
1,033.64 0.00 179.36<br />
45.42 (5.38) 219.40<br />
814.24<br />
Previous year<br />
Add: Capital<br />
al<br />
Work-in-P<br />
ork-in-Progress<br />
rogress 20.65 38.91 0.00 59.56 0.00 59.56<br />
873.80<br />
Notes :<br />
Depreciation for the year 45.42<br />
Add: Obsolescence 0.00<br />
Less: Depreciation transferred<br />
to Pre-operative Expenses 0.00<br />
Depreciation as per Profit and Loss Account 45.42<br />
136