2010-11 - Grasim
2010-11 - Grasim
2010-11 - Grasim

Create successful ePaper yourself
Turn your PDF publications into a flip-book with our unique Google optimized e-Paper software.
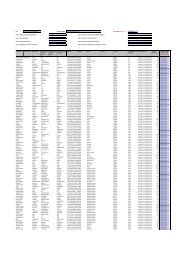
ULTRATECH CEMENT<br />
MIDDLE EAST INVESTMENTS LIMITED<br />
CONSOLIDATED CASH FLOW STATEMENT TEMENT FOR THE YEAR ENDED MARCH 31, 20<strong>11</strong><br />
Amount in AED crores<br />
Amount in INR crores<br />
Mar 31, 20<strong>11</strong> Mar 31, <strong>2010</strong> Mar 31, 20<strong>11</strong> Mar 31, <strong>2010</strong><br />
A<br />
Cash Flow from Operating Activities:<br />
Profit before tax<br />
(4.22) — (53.53) (0.04)<br />
Adjustments for:<br />
Depreciation and Obsolescence 3.66 — 45.42 —<br />
Provision for Retirement benefits 0.08 — 0.91 —<br />
Interest and Dividend Income (—) — (0.05) —<br />
Interest and Finance Charges 1.78<br />
— 22.10 —<br />
Operating Profit Bef<br />
efore<br />
Working<br />
Capital al Changes 1.29<br />
— 14.86<br />
(0.04)<br />
Adjustments for:<br />
(Increase)/decrease in Inventories 1.61<br />
— 19.68<br />
—<br />
(Increase)/decrease in Sundry Debtors (3.00)<br />
0) — (35.95) —<br />
(Increase)/decrease in Loans and Advances (0.54) — (6.13)<br />
—<br />
Increase/(decrease) in Trade Payables<br />
and other Liabilities (7.39)<br />
— (92.83) 0.01<br />
Net Cash Generated From Operations (A) (8.02) — (100.38)<br />
0.38) (0.03)<br />
B<br />
Cash Flow from Investing<br />
Activities:<br />
Purchase of Fixed Assets (3.19)<br />
— (32.32) —<br />
Investment in subsidiaries (59.08) — (717.40)<br />
—<br />
Interest and Dividend Received 0.00 — 0.05 —<br />
Net Cash used in Investing<br />
Activities (B) (62.27) — (749.67)<br />
—<br />
C<br />
Cash Flow from Financing Activities:<br />
Proceeds from Issue of Share Capital 14.88<br />
0.60 180.60<br />
7.34<br />
Proceeds from Long Term Borrowings 58.24 — 702.00 —<br />
Interest and Finance Charges paid (1.78)<br />
— (22.10)<br />
—<br />
Net Cash Generated / (Used) from<br />
Financing Activities (C) 71.34<br />
0.60 860.50 7.34<br />
Net Increase/(Decrease) in cash and<br />
cash equivalents (A + B + C) 1.05<br />
0.60 10.45<br />
7.31<br />
Cash and Cash Equivalents at<br />
the Beginning of the Year<br />
0.60 — 7.31<br />
—<br />
Cash & Cash equivalent transfer<br />
erred red on<br />
account of requisition of ETA STAR<br />
0.51 — 6.28 —<br />
Effect of exchange rate on consolidation<br />
of Foreign Subsidiary 0.<strong>11</strong> — 3.56 —<br />
Cash and Cash Equivalents at the End of the Year<br />
2.27 0.60 27.60<br />
.60 7.31<br />
Notes:<br />
1. Cash flow statement has been prepared under the indirect method as set out in Accounting Standard - 3<br />
notified under the Companies (Accounting Standard) Rules, 2006.<br />
2. Purchase of fixed assets includes movements of capital work-in-progress during the year.<br />
3. Cash and cash equivalents represent cash and bank balances.<br />
In terms of our report attached.<br />
For and on behalf of the Board of Directors<br />
For or MAHENDRA ASHER & CO.<br />
Chartered Accountants<br />
O. . P. P<br />
. Puranmalka<br />
Director<br />
R. N. SHETTY<br />
Partner<br />
K. C. Birla<br />
Director<br />
Dubai, April 21, 20<strong>11</strong><br />
134