2010-11 - Grasim
2010-11 - Grasim
2010-11 - Grasim

Create successful ePaper yourself
Turn your PDF publications into a flip-book with our unique Google optimized e-Paper software.
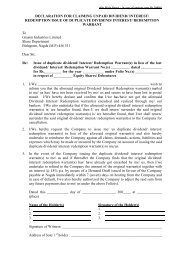
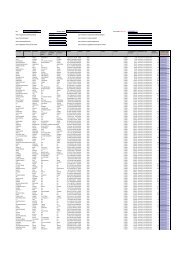
ULTRATECH CEMENT<br />
MIDDLE EAST INVESTMENTS LIMITED<br />
Consolidated Profit and Loss<br />
Account for the period ended March 31, 20<strong>11</strong><br />
Amount in AED Crores<br />
Amount in INR Crores<br />
Schedules<br />
As at As at As at<br />
As at<br />
Mar 31, 20<strong>11</strong> Mar 31, <strong>2010</strong> Mar 31, 20<strong>11</strong> Mar 31, <strong>2010</strong><br />
INCOME<br />
Gross Sales 30.01 — 372.28 —<br />
Less: Excise Duty / VAT 0.00 — — —<br />
Net Sales 30.01 — 372.28 —<br />
Operating Income 12 0.12 — 1.55<br />
—<br />
Other Income 13 0.16 — 1.99<br />
—<br />
Increase / (Decrease) in Stocks 14 1.99<br />
— 23.49 —<br />
32.29 — 399.30 —<br />
EXPENDITURE<br />
Raw Materials Consumed 15 12.99<br />
— 161<br />
61.1<br />
.12 —<br />
Manufacturing Expenses 16 14.25<br />
— 176.70<br />
—<br />
Payments to and Provisions for Employees 17 2.29 — 28.36 —<br />
Selling, Distribution,<br />
Administration and Other Expenses 18 1.54<br />
— 19.1<br />
9.14 0.04<br />
Interest and Finance Charges 19 1.78<br />
— 22.10 —<br />
Depreciation and Obsolescence 3.66 — 45.42 —<br />
36.51 — 452.83 0.04<br />
Profit/(L<br />
rofit/(Loss) oss) Bef<br />
efore<br />
Tax Expenses (4.22) (—) (53.53) (0.04)<br />
Income Tax Expenses<br />
Provision for Current Tax — — — —<br />
Deferred Tax (0.30) — (3.71) —<br />
Profit/(L<br />
rofit/(Loss)<br />
oss) After<br />
Tax<br />
(3.92) (—) (49.83) (0.04)<br />
Minority Interest (0.68) — (8.47) —<br />
Profit/(L<br />
rofit/(Loss) oss) after Minority Interest (3.24) (—) (41.36)<br />
(0.04)<br />
Balance brought forward from Previous Year (0.00)<br />
0) — (0.04) —<br />
Profit/(L<br />
rofit/(Loss)<br />
oss) Available for<br />
Appropriation (3.24) (—) (41.40)<br />
(0.04)<br />
Appropriations<br />
Balance carried to Balance Sheet (3.24) (—) (41.40)<br />
(0.04)<br />
(3.24) (—) (41.40)<br />
(0.04)<br />
Basic Earnings Per Equity Share (3.74)<br />
(0.05) (47.73)<br />
—<br />
Diluted Earnings Per er Equity y Share (3.74)<br />
(0.05) (47.73)<br />
—<br />
Face Value Per Equity Share 10.0<br />
0.00 10.00 121<br />
21.43<br />
.43 10.00<br />
Weighted Average Number Of Equity Shares (in Nos.) 8,666,018 600,000 8,666,018 600,000<br />
Weighted Average Number Of Equity Shares incl<br />
Diluted Shares (in Nos.) 8,666,018 600,000 8,666,018 600,000<br />
Accounting Policies and<br />
Notes on Accounts<br />
20<br />
In terms of our report attached.<br />
For or MAHENDRA ASHER & CO.<br />
Chartered Accountants<br />
R. N. SHETTY<br />
Partner<br />
For and on behalf of the Board of Directors<br />
O. . P. P<br />
. Puranmalka<br />
Director<br />
K. C. Birla<br />
Director<br />
Dubai, April 21, 20<strong>11</strong><br />
133 ⊳