Exhibits Vol 2 - Independent Pilots Association
Exhibits Vol 2 - Independent Pilots Association
Exhibits Vol 2 - Independent Pilots Association

You also want an ePaper? Increase the reach of your titles
YUMPU automatically turns print PDFs into web optimized ePapers that Google loves.
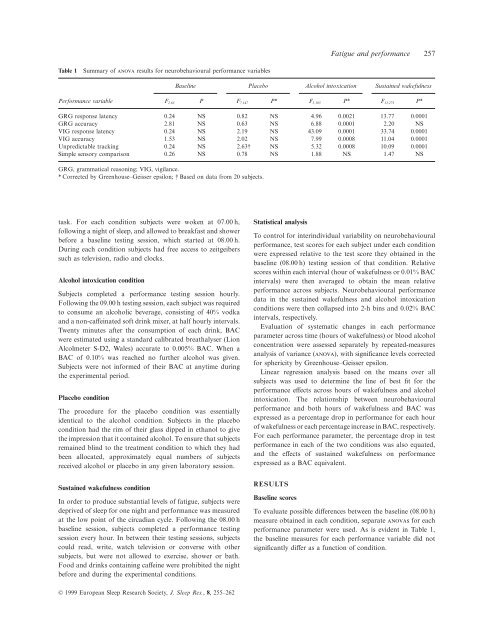
Fatigue and performance 257<br />
Table 1<br />
Summary of anova results for neurobehavioural performance variables<br />
Baseline Placebo Alcohol intoxication Sustained wakefulness<br />
Performance variable F 2,63 P F 7,147 P∗ F 5,105 P∗ F 13,273 P∗<br />
GRG response latency 0.24 NS 0.82 NS 4.96 0.0021 13.77 0.0001<br />
GRG accuracy 2.81 NS 0.63 NS 6.88 0.0001 2.20 NS<br />
VIG response latency 0.24 NS 2.19 NS 43.09 0.0001 33.74 0.0001<br />
VIG accuracy 1.53 NS 2.02 NS 7.99 0.0008 11.04 0.0001<br />
Unpredictable tracking 0.24 NS 2.63† NS 5.32 0.0008 10.09 0.0001<br />
Simple sensory comparison 0.26 NS 0.78 NS 1.88 NS 1.47 NS<br />
GRG, grammatical reasoning; VIG, vigilance.<br />
∗ Corrected by Greenhouse–Geisser epsilon; † Based on data from 20 subjects.<br />
task. For each condition subjects were woken at 07.00 h, Statistical analysis<br />
following a night of sleep, and allowed to breakfast and shower<br />
To control for interindividual variability on neurobehavioural<br />
before a baseline testing session, which started at 08.00 h.<br />
performance, test scores for each subject under each condition<br />
During each condition subjects had free access to zeitgeibers<br />
were expressed relative to the test score they obtained in the<br />
such as television, radio and clocks.<br />
baseline (08.00 h) testing session of that condition. Relative<br />
scores within each interval (hour of wakefulness or 0.01% BAC<br />
Alcohol intoxication condition<br />
intervals) were then averaged to obtain the mean relative<br />
performance across subjects. Neurobehavioural performance<br />
Subjects completed a performance testing session hourly.<br />
data in the sustained wakefulness and alcohol intoxication<br />
Following the 09.00 h testing session, each subject was required<br />
conditions were then collapsed into 2-h bins and 0.02% BAC<br />
to consume an alcoholic beverage, consisting of 40% vodka<br />
intervals, respectively.<br />
and a non-caffeinated soft drink mixer, at half hourly intervals.<br />
Evaluation of systematic changes in each performance<br />
Twenty minutes after the consumption of each drink, BAC<br />
parameter across time (hours of wakefulness) or blood alcohol<br />
were estimated using a standard calibrated breathalyser (Lion<br />
concentration were assessed separately by repeated-measures<br />
Alcolmeter S-D2, Wales) accurate to 0.005% BAC. When a<br />
analysis of variance (anova), with significance levels corrected<br />
BAC of 0.10% was reached no further alcohol was given.<br />
for sphericity by Greenhouse–Geisser epsilon.<br />
Subjects were not informed of their BAC at anytime during<br />
Linear regression analysis based on the means over all<br />
the experimental period.<br />
subjects was used to determine the line of best fit for the<br />
performance effects across hours of wakefulness and alcohol<br />
Placebo condition intoxication. The relationship between neurobehavioural<br />
The procedure for the placebo condition was essentially<br />
performance and both hours of wakefulness and BAC was<br />
identical to the alcohol condition. Subjects in the placebo<br />
expressed as a percentage drop in performance for each hour<br />
condition had the rim of their glass dipped in ethanol to give<br />
of wakefulness or each percentage increase in BAC, respectively.<br />
the impression that it contained alcohol. To ensure that subjects<br />
For each performance parameter, the percentage drop in test<br />
remained blind to the treatment condition to which they had<br />
performance in each of the two conditions was also equated,<br />
been allocated, approximately equal numbers of subjects<br />
and the effects of sustained wakefulness on performance<br />
received alcohol or placebo in any given laboratory session.<br />
expressed as a BAC equivalent.<br />
Sustained wakefulness condition<br />
RESULTS<br />
In order to produce substantial levels of fatigue, subjects were<br />
Baseline scores<br />
deprived of sleep for one night and performance was measured To evaluate possible differences between the baseline (08.00 h)<br />
at the low point of the circadian cycle. Following the 08.00 h measure obtained in each condition, separate anovas for each<br />
baseline session, subjects completed a performance testing performance parameter were used. As is evident in Table 1,<br />
session every hour. In between their testing sessions, subjects the baseline measures for each performance variable did not<br />
could read, write, watch television or converse with other significantly differ as a function of condition.<br />
subjects, but were not allowed to exercise, shower or bath.<br />
Food and drinks containing caffeine were prohibited the night<br />
before and during the experimental conditions.<br />
© 1999 European Sleep Research Society, J. Sleep Res., 8, 255–262