Exhibits Vol 2 - Independent Pilots Association
Exhibits Vol 2 - Independent Pilots Association
Exhibits Vol 2 - Independent Pilots Association

You also want an ePaper? Increase the reach of your titles
YUMPU automatically turns print PDFs into web optimized ePapers that Google loves.
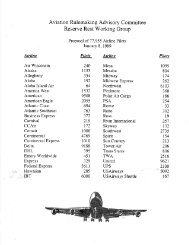
FATIGUE MODEL VALIDATION<br />
71<br />
Fatigue Score<br />
90<br />
80<br />
70<br />
60<br />
50<br />
40<br />
30<br />
20<br />
10<br />
GRT Response Time<br />
1 3 5 7 9 11 13 15 17 19 21 23 25 27<br />
Hours of Wakefulness<br />
40<br />
30<br />
20<br />
10<br />
0<br />
-10<br />
-20<br />
Mean Relative<br />
Performance<br />
Fatigue Score<br />
90<br />
80<br />
70<br />
60<br />
50<br />
40<br />
30<br />
20<br />
10<br />
GRT Error Rate<br />
1 4 7 10 13 16 19 22 25<br />
Hours of Wakefulness<br />
6<br />
4<br />
2<br />
0<br />
-2<br />
-4<br />
-6<br />
-8<br />
Mean Relative<br />
Performance<br />
Fatigue Score<br />
90<br />
80<br />
70<br />
60<br />
50<br />
40<br />
30<br />
20<br />
10<br />
VIG Error Rate<br />
1 3 5 7 9 11 13 15 17 19 21 23 25 27<br />
Hours of Wakefulness<br />
10<br />
8<br />
6<br />
4<br />
2<br />
0<br />
-2<br />
-4<br />
-6<br />
-8<br />
-10<br />
Mean Relative<br />
Performance<br />
Fatigue Score<br />
90<br />
80<br />
70<br />
60<br />
50<br />
40<br />
30<br />
20<br />
10<br />
TRK Score<br />
30<br />
20<br />
10<br />
0<br />
-10<br />
-20<br />
-30<br />
1 3 5 7 9 11 13 15 17 19 21 23 25 27<br />
Hours of Wakefulness<br />
Mean Relative<br />
Performance<br />
Fatigue Score<br />
90<br />
80<br />
70<br />
60<br />
50<br />
40<br />
30<br />
20<br />
10<br />
VIG Response Time<br />
25<br />
20<br />
15<br />
10<br />
5<br />
0<br />
-5<br />
1 3 5 7 9 11 13 15 17 19 21 23 25 27<br />
Hours of Wakefulness<br />
Mean Relative<br />
Performance<br />
Figure 3. Predicted fatigue score (left y-axis; open circles) and mean relative performance (right y-axis; filled squares) for each of the indicated<br />
performance measures against increasing during wakefulness.<br />
subsequently produced negative correlation coefficients (R), as<br />
predicted fatigue scores increased as relative performance<br />
values decreased, and vice-versa.<br />
Regression Analyses<br />
The regression equations for performance measures were<br />
determined separately, with either fatigue score or BAC as the<br />
dependent measure. Table 1 displays the regression equations<br />
for each of the six measures with fatigue score as the<br />
dependent measure. Table 2 displays the regression equations<br />
for each of the measures with BAC as the dependent measure.<br />
The best-fit polynomial regression equations were then<br />
simultaneously solved for both fatigue score and BAC. It was<br />
found that solving polynomial equations in some cases<br />
produced a complex number (i.e., square root of a negative<br />
number) with no straightforward mathematical solution.<br />
Below, we report numerical solutions for each statistically<br />
Table 1<br />
significant performance measure where these were available<br />
from solved polynomial regressions. Table 3 displays the BAC<br />
equivalent values (rounded to 2 decimal places) of<br />
performance decline based on fatigue scores from 10 to 100.<br />
Time-series Analysis<br />
Time-series analyses revealed that the circadian rhythms in<br />
performance measures that were predicted by the work-related<br />
fatigue model and those observed in the collected data differed<br />
by between one and four hours. In all six measures, the workrelated<br />
fatigue model predicted that the performance minimum<br />
occurred earlier than what was measured in the laboratory.<br />
Table 5 displays the lag maximum time for each of the six<br />
measures (difference between the predicted and ‘maximum fit’<br />
time relationships). The lag maximum time indicates the<br />
number of hours that the fatigue model’s predictions precede<br />
the actual performance minimums.<br />
Table 2<br />
Measure Regression Equation R 2 p<br />
Y 1<br />
GRT Mean Response 0-0.12 x FAT<br />
+ 0.01 x FAT<br />
2<br />
0.68