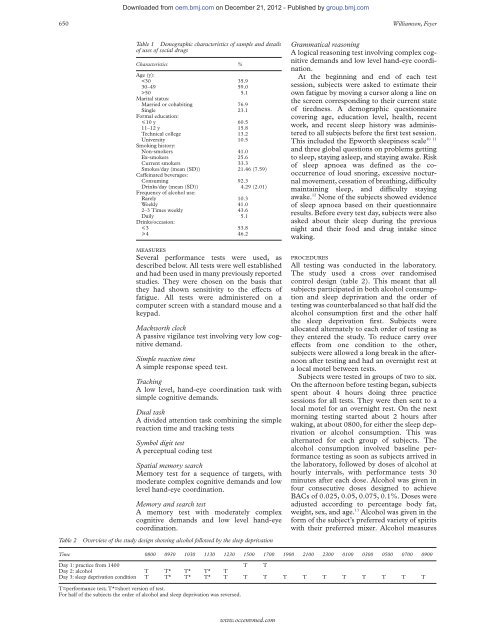
Downloaded from oem.bmj.com on December 21, 2012 - Published by group.bmj.com 650 Williamson, Feyer Table 2 Table 1 Demographic characteristics of sample and details of uses of social drugs Characteristics % Age (y): 50 5.1 Marital status: Married or cohabiting 76.9 Single 23.1 Formal education:
Downloaded from oem.bmj.com on December 21, 2012 - Published by group.bmj.com Sleep deprivation produces impairments equivalent to those of alcohol intoxication 651 (blood-breath equivalents) were taken with a breathlyser (Drager Alcotest 7110) immediately before and after each test session and then hourly until the subjects’ alcohol concentrations were below 0.05%. The subjects were then allowed to leave the test centre. The sleep deprivation involved the same sequence of testing as for the alcohol consumption, with tests every hour from baseline to the 5th hour, as in the alcohol consumption, then every 2nd hour for the next 20 hours. The last test occurred 28 hours after waking. There were five performance test sessions in all for the alcohol consumption and 15 for the sleep deprivation. The order of tests was randomised within each test session. Most tests were used in all sessions: however, three tests (grammatical reasoning, spatial memory search, and memory and search task) were dropped from the second, third, and fourth test sessions to allow time for alcohol to be drunk and absorbed. This procedure was also used for the sleep deprivation so that direct comparisons could be made between the conditions. STATISTICAL ANALYSIS For statistical analysis, for each subject the BACs recorded at the start and end of each of the five test sessions were averaged to produce a single value for each test session. These average BACs and the associated performance test measures were plotted separately against test session for each subject. Due to individual differences in absorption of alcohol, the observed BACs were not always at the anticipated level at each test session. This meant that the time at which the exact BACs of 0.025%, 0.05%, 0.075%, and 0.1% were reached had to be interpolated from the graph for each subject. These times were then identified on the graph of performance test measures against test session and the corresponding test scores could then be interpolated for each subject. By this method it was possible to estimate the performance test score corresponding to each concentration of alcohol for each subject. These concentrations were then averaged across subjects to show change in performance with each alcohol dose. Performances at the BACs of 0.05% and 0.1% were then compared with performance across sleep deprivation test sessions 8–13 (at times 1900–0500) for each subject. This time window was chosen for the sleep deprivation condition before the data were collected because this period was most likely to produce eVects of fatigue as it covered the longest periods of sleep deprivation and covered the period of the major circadian trough. This decision was reinforced when the sleep deprivation and performance relation was plotted after data collection, as this period also showed the clearest linear trend across test sessions for all measures. For this analysis, time was treated as a continuously increasing quantity across midnight, for example, 20 hours of sleep deprivation occurred at 0200, as the waking time had been about 0600. Over this time window, the sessions between which performance under the sleep deprivation first became worse than the Table 3 Amount and quality of sleep the night before alcohol and sleep deprivation Before alcohol Mean (SD) Before sleep deprivation Mean (SD) Amount of sleep 7.5 (2.4) 7.2 (1.0) Rated quality of sleep 71.5 (25.0) 58.7 (24.9) Ratings of freshness at waking 72.7 (19.8) 65.2 (22.6) performance found at BACs of 0.05% and 0.1% were noted for each subject. With interpolation, the time since waking associated with performance equivalent to that at the two alcohol concentrations were then identified for each subject. The scores for time since waking were then averaged across subjects for each performance measure. Not all subjects contributed to the time since waking scores for each measure as not all subjects showed a deterioration in performance over this time window for all performance tests. Only data from subjects who showed a change from better than the BACs of 0.05% and 0.1% to worse than these criterion concentrations over the 1900 to 0500 window were included in the averages for each test. The number of subjects contributing to each hour of wakefulness equivalent to the BACs therefore reflects the percentage of subjects who showed significant deterioration in performance over the selected time window. Results Subjects were reasonably well rested after a mean of 7.54 and 7.16 hours overnight sleep immediately before each test condition, for alcohol comsumption and sleep deprivation respectively (table 3). Although sleep quality was rated as significantly lower before sleep deprivation, the amount of sleep and ratings of feeling fresh after waking did not diVer between the conditions, indicating that subjects were not partially sleep deprived before either test condition. As expected, increasing concentrations of alcohol produced significant reductions in performance for most tests and measures. Table 4 shows the results of the estimated change in performance due to varying amounts of alcohol compared with baseline, no alcohol. The results show that the extent of loss of function varies between tests although there were consistent eVects within diVerent types of measures. At a BAC of 0.05% for example, response speed decreased by around 8%–15% for reaction time, dual task, Mackworth vigilance, and symbol digit tests corresponding to a slowing of around 45, 66, 136, and 182 ms respectively. Hand-eye coordination measures showed a similar overall decrement of around 10% at this BAC. Measures of overall test accuracy also showed significant decrements due to alcohol, especially the number of missed signals in the reaction time test, which increased by 200%, and the number of false alarm responses in the Mackworth test, which were more than 50% higher at a BAC of 0.05%. The number of correct responses in the Mackworth test and length of the recalled series in the spatial memory task also both www.occenvmed.com