10 07 29 Master thesis Juliana Leon - e-Waste. This guide
10 07 29 Master thesis Juliana Leon - e-Waste. This guide
10 07 29 Master thesis Juliana Leon - e-Waste. This guide

Create successful ePaper yourself
Turn your PDF publications into a flip-book with our unique Google optimized e-Paper software.
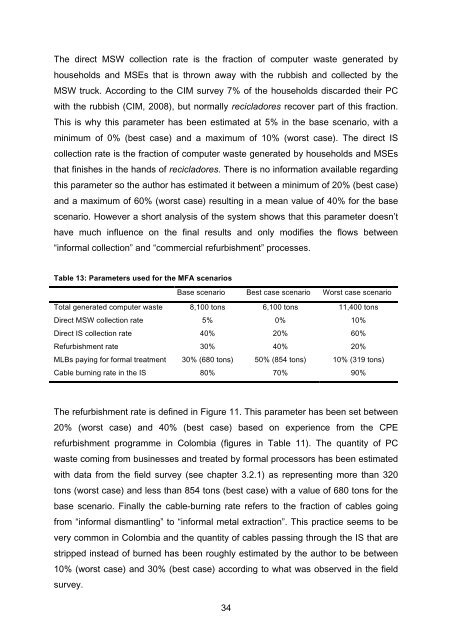
The direct MSW collection rate is the fraction of computer waste generated by<br />
households and MSEs that is thrown away with the rubbish and collected by the<br />
MSW truck. According to the CIM survey 7% of the households discarded their PC<br />
with the rubbish (CIM, 2008), but normally recicladores recover part of this fraction.<br />
<strong>This</strong> is why this parameter has been estimated at 5% in the base scenario, with a<br />
minimum of 0% (best case) and a maximum of <strong>10</strong>% (worst case). The direct IS<br />
collection rate is the fraction of computer waste generated by households and MSEs<br />
that finishes in the hands of recicladores. There is no information available regarding<br />
this parameter so the author has estimated it between a minimum of 20% (best case)<br />
and a maximum of 60% (worst case) resulting in a mean value of 40% for the base<br />
scenario. However a short analysis of the system shows that this parameter doesn’t<br />
have much influence on the final results and only modifies the flows between<br />
“informal collection” and “commercial refurbishment” processes.<br />
Table 13: Parameters used for the MFA scenarios<br />
Base scenario Best case scenario Worst case scenario<br />
Total generated computer waste 8,<strong>10</strong>0 tons 6,<strong>10</strong>0 tons 11,400 tons<br />
Direct MSW collection rate 5% 0% <strong>10</strong>%<br />
Direct IS collection rate 40% 20% 60%<br />
Refurbishment rate 30% 40% 20%<br />
MLBs paying for formal treatment 30% (680 tons) 50% (854 tons) <strong>10</strong>% (319 tons)<br />
Cable burning rate in the IS 80% 70% 90%<br />
The refurbishment rate is defined in Figure 11. <strong>This</strong> parameter has been set between<br />
20% (worst case) and 40% (best case) based on experience from the CPE<br />
refurbishment programme in Colombia (figures in Table 11). The quantity of PC<br />
waste coming from businesses and treated by formal processors has been estimated<br />
with data from the field survey (see chapter 3.2.1) as representing more than 320<br />
tons (worst case) and less than 854 tons (best case) with a value of 680 tons for the<br />
base scenario. Finally the cable-burning rate refers to the fraction of cables going<br />
from “informal dismantling” to “informal metal extraction”. <strong>This</strong> practice seems to be<br />
very common in Colombia and the quantity of cables passing through the IS that are<br />
stripped instead of burned has been roughly estimated by the author to be between<br />
<strong>10</strong>% (worst case) and 30% (best case) according to what was observed in the field<br />
survey.<br />
34