Annual r eport 2002 Annual r eport 2002 - Boskalis
Annual r eport 2002 Annual r eport 2002 - Boskalis
Annual r eport 2002 Annual r eport 2002 - Boskalis

You also want an ePaper? Increase the reach of your titles
YUMPU automatically turns print PDFs into web optimized ePapers that Google loves.
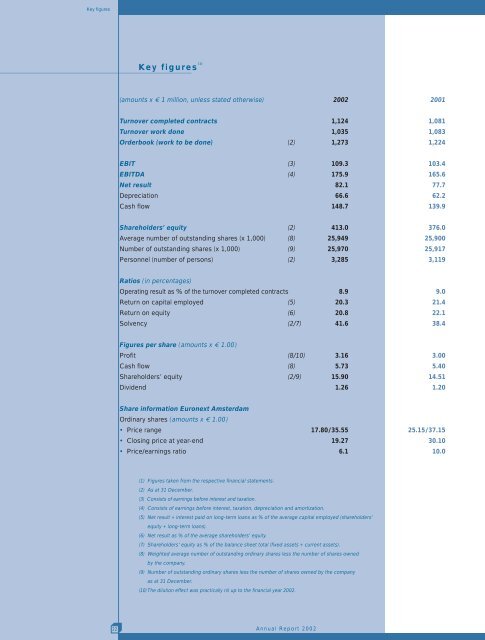
Key figures<br />
Key figures (1) <strong>Annual</strong> R<strong>eport</strong> <strong>2002</strong><br />
(amounts x € 1 million, unless stated otherwise) <strong>2002</strong> 2001<br />
Turnover completed contracts 1,124 1,081<br />
Turnover work done 1,035 1,083<br />
Orderbook (work to be done) (2) 1,273 1,224<br />
EBIT (3) 109.3 103.4<br />
EBITDA (4) 175.9 165.6<br />
Net result 82.1 77.7<br />
Depreciation 66.6 62.2<br />
Cash flow 148.7 139.9<br />
Shareholders’ equity (2) 413.0 376.0<br />
Average number of outstanding shares (x 1,000) (8) 25,949 25,900<br />
Number of outstanding shares (x 1,000) (9) 25,970 25,917<br />
Personnel (number of persons) (2) 3,285 3,119<br />
Ratios (in percentages)<br />
Operating result as % of the turnover completed contracts 8.9 9.0<br />
Return on capital employed (5) 20.3 21.4<br />
Return on equity (6) 20.8 22.1<br />
Solvency (2/7) 41.6 38.4<br />
Figures per share (amounts x € 1.00)<br />
Profit (8/10) 3.16 3.00<br />
Cash flow (8) 5.73 5.40<br />
Shareholders’ equity (2/9) 15.90 14.51<br />
Dividend 1.26 1.20<br />
Share information Euronext Amsterdam<br />
Ordinary shares (amounts x € 1.00)<br />
• Price range 17.80/35.55 25.15/37.15<br />
• Closing price at year-end 19.27 30.10<br />
• Price/earnings ratio 6.1 10.0<br />
(1) Figures taken from the respective financial statements.<br />
(2) As at 31 December.<br />
(3) Consists of earnings before interest and taxation.<br />
(4) Consists of earnings before interest, taxation, depreciation and amortization.<br />
(5) Net result + interest paid on long-term loans as % of the average capital employed (shareholders’<br />
equity + long-term loans).<br />
(6) Net result as % of the average shareholders’ equity.<br />
(7) Shareholders’ equity as % of the balance sheet total (fixed assets + current assets).<br />
(8) Weighted average number of outstanding ordinary shares less the number of shares owned<br />
by the company.<br />
(9) Number of outstanding ordinary shares less the number of shares owned by the company<br />
as at 31 December.<br />
(10) The dilution effect was practically nil up to the financial year <strong>2002</strong>.<br />
22