2012 Annual Report & Financial Statements - UBA Plc
2012 Annual Report & Financial Statements - UBA Plc
2012 Annual Report & Financial Statements - UBA Plc

You also want an ePaper? Increase the reach of your titles
YUMPU automatically turns print PDFs into web optimized ePapers that Google loves.
154<br />
Notes to the consolidated and separate financial statements<br />
continued …<br />
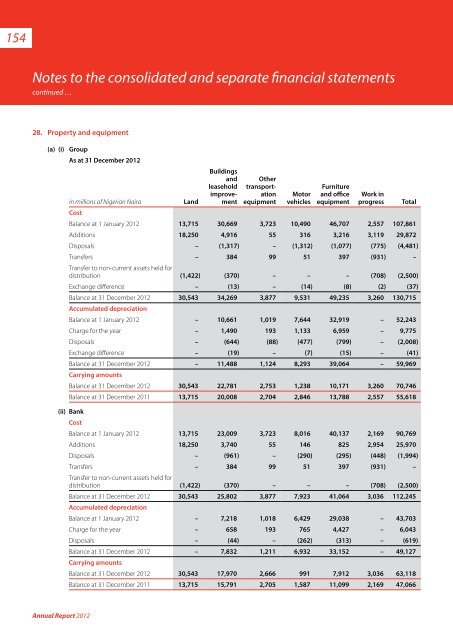
28. Property and equipment<br />
(a) (i)<br />
Group<br />
As at 31 December <strong>2012</strong><br />
In millions of Nigerian Naira<br />
Land<br />
Buildings<br />
and<br />
leasehold<br />
improvement<br />
Other<br />
transportation<br />
equipment<br />
Motor<br />
vehicles<br />
Furniture<br />
and office<br />
equipment<br />
Work in<br />
progress<br />
Cost<br />
Balance at 1 January <strong>2012</strong> 13,715 30,669 3,723 10,490 46,707 2,557 107,861<br />
Additions 18,250 4,916 55 316 3,216 3,119 29,872<br />
Disposals – (1,317) – (1,312) (1,077) (775) (4,481)<br />
Transfers – 384 99 51 397 (931) –<br />
Transfer to non-current assets held for<br />
distribution (1,422) (370) – – – (708) (2,500)<br />
Exchange difference – (13) – (14) (8) (2) (37)<br />
Balance at 31 December <strong>2012</strong> 30,543 34,269 3,877 9,531 49,235 3,260 130,715<br />
Accumulated depreciation<br />
Balance at 1 January <strong>2012</strong> – 10,661 1,019 7,644 32,919 – 52,243<br />
Charge for the year – 1,490 193 1,133 6,959 – 9,775<br />
Disposals – (644) (88) (477) (799) – (2,008)<br />
Exchange difference – (19) – (7) (15) – (41)<br />
Balance at 31 December <strong>2012</strong> – 11,488 1,124 8,293 39,064 – 59,969<br />
Carrying amounts<br />
Balance at 31 December <strong>2012</strong> 30,543 22,781 2,753 1,238 10,171 3,260 70,746<br />
Balance at 31 December 2011 13,715 20,008 2,704 2,846 13,788 2,557 55,618<br />
Total<br />
(ii) Bank<br />
Cost<br />
Balance at 1 January <strong>2012</strong> 13,715 23,009 3,723 8,016 40,137 2,169 90,769<br />
Additions 18,250 3,740 55 146 825 2,954 25,970<br />
Disposals – (961) – (290) (295) (448) (1,994)<br />
Transfers – 384 99 51 397 (931) –<br />
Transfer to non-current assets held for<br />
distribution (1,422) (370) – – – (708) (2,500)<br />
Balance at 31 December <strong>2012</strong> 30,543 25,802 3,877 7,923 41,064 3,036 112,245<br />
Accumulated depreciation<br />
Balance at 1 January <strong>2012</strong> – 7,218 1,018 6,429 29,038 – 43,703<br />
Charge for the year – 658 193 765 4,427 – 6,043<br />
Disposals – (44) – (262) (313) – (619)<br />
Balance at 31 December <strong>2012</strong> – 7,832 1,211 6,932 33,152 – 49,127<br />
Carrying amounts<br />
Balance at 31 December <strong>2012</strong> 30,543 17,970 2,666 991 7,912 3,036 63,118<br />
Balance at 31 December 2011 13,715 15,791 2,705 1,587 11,099 2,169 47,066<br />
<strong>Annual</strong> <strong>Report</strong> <strong>2012</strong>