- Page 1 and 2: United Bank for Africa Plc RC: 2457
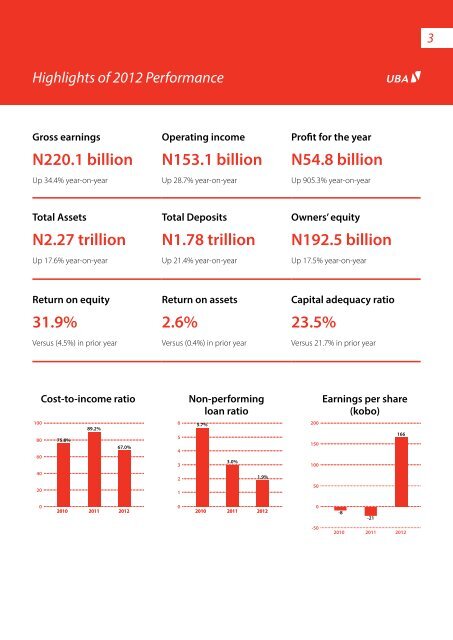
- Page 3: 1 United Bank for Africa (UBA) Plc
- Page 7 and 8: 5 Emmanuel N. Nnorom, Executive Dir
- Page 9 and 10: 7 Angela Aneke, Non-Executive Direc
- Page 11 and 12: 9 Emem Etuk, Regional Bank Head (Cr
- Page 13 and 14: 11 Chairman’s Statement “We ach
- Page 15 and 16: 13 Sustainability In conducting our
- Page 17 and 18: 15 Chief Executive Officer’s Repo
- Page 19 and 20: 17 Net interest income grew by 34.3
- Page 21 and 22: 19 Review of Group Strategy Driven
- Page 23 and 24: 21 UBA POST-RESTRUCTURE SHAREHOLDER
- Page 25 and 26: 23 Group Financial Performance Revi
- Page 27 and 28: 25 Non-Performing Loan Ratio (%) Ou
- Page 29 and 30: 27 Review of UBA’s e-Banking Reso
- Page 31 and 32: 29 Services (SMS, e-Mail Notificati
- Page 33 and 34: 31 Education 2012 Projects include
- Page 35 and 36: 33 Projects Besides these projects,
- Page 37 and 38: 35 6. DIRECTORS The names of the Di
- Page 39 and 40: 37 10. SUMMARY OF DEALING IN UBA SH
- Page 41 and 42: 39 As a reflection of our diverse w
- Page 43 and 44: 41 Customer Complaints Report Intro
- Page 45 and 46: 43 Reports of the complaints receiv
- Page 47 and 48: 45 Appointments and retirements Dur
- Page 49 and 50: 47 Meetings are held at least once
- Page 51 and 52: 49 S/N Members Number of meetings h
- Page 53 and 54: 51 Audit Committee Report TO MEMBER
- Page 55 and 56:
53 Statement of Directors’ Respon
- Page 57 and 58:
55 Report on other legal requiremen
- Page 59 and 60:
57 Consolidated and Separate Statem
- Page 61 and 62:
59 (ii) Bank In millions of Nigeria
- Page 63 and 64:
61 (ii) Bank In millions of Nigeria
- Page 65 and 66:
63 Notes to the consolidated and se
- Page 67 and 68:
65 recognition of further losses is
- Page 69 and 70:
67 Deferred tax assets and liabilit
- Page 71 and 72:
69 - there is an observable data in
- Page 73 and 74:
71 Any interest in transferred fina
- Page 75 and 76:
73 (n) Intangible assets (i) Goodwi
- Page 77 and 78:
75 (v) (w) (x) Fiduciary activities
- Page 79 and 80:
77 Impairment losses on initial cla
- Page 81 and 82:
79 These Board committees are suppo
- Page 83 and 84:
81 In playing this role, GALCO does
- Page 85 and 86:
83 Risk Management Structure In res
- Page 87 and 88:
85 Financial crime risk This is the
- Page 89 and 90:
87 The universal market risk factor
- Page 91 and 92:
89 Business continuity management B
- Page 93 and 94:
91 - periodic vulnerability assessm
- Page 95 and 96:
93 General risk rating process Unit
- Page 97 and 98:
95 An estimate of the fair value of
- Page 99 and 100:
97 Concentration by location (net)
- Page 101 and 102:
99 Bank In millions of Nigerian Nai
- Page 103 and 104:
101 Bank For the year ended 31 Dece
- Page 105 and 106:
103 Loans and advances individually
- Page 107 and 108:
105 Statement of Prudential adjustm
- Page 109 and 110:
107 Group In millions of Nigerian N
- Page 111 and 112:
109 Liquidity risk management focus
- Page 113 and 114:
111 The tables below show the undis
- Page 115 and 116:
113 1 January 2011 In millions of N
- Page 117 and 118:
115 Market risk profile The Group
- Page 119 and 120:
117 Analysis of the Group’s sensi
- Page 121 and 122:
119 Group 31 December 2012 In milli
- Page 123 and 124:
121 Group Bank Group Bank Group Ban
- Page 125 and 126:
123 Group In millions of Nigerian N
- Page 127 and 128:
125 Fixed income re-pricing gap Pri
- Page 129 and 130:
127 Tier 2 capital, which includes
- Page 131 and 132:
129 5. USE OF ESTIMATES AND JUDGEME
- Page 133 and 134:
131 (b) (i) Group: December 2011 In
- Page 135 and 136:
133 Business segments The Group ope
- Page 137 and 138:
135 (b) Business reporting (i) 31 D
- Page 139 and 140:
137 7. Financial assets and liabili
- Page 141 and 142:
139 The table below sets out the Ba
- Page 143 and 144:
141 9. Net fees and commission inco
- Page 145 and 146:
143 16. Other operating expenses In
- Page 147 and 148:
145 (c) Analysis of the result of d
- Page 149 and 150:
147 21. Financial assets held-for-t
- Page 151 and 152:
149 24. Investment securities In mi
- Page 153 and 154:
151 In millions of Nigerian Naira (
- Page 155 and 156:
153 In millions of Nigerian Naira B
- Page 157 and 158:
155 (b) (i) Group As at 31 December
- Page 159 and 160:
157 29. Intangible assets continued
- Page 161 and 162:
159 30. Deferred tax assets and lia
- Page 163 and 164:
161 30. Deferred tax assets and lia
- Page 165 and 166:
163 34. Other liabilities continued
- Page 167 and 168:
165 37. Capital and reserves contin
- Page 169 and 170:
167 40. Related parties United Bank
- Page 171 and 172:
169 41. Compensation to Employees a
- Page 173 and 174:
171 44. Explanation of transition t
- Page 175 and 176:
173 Reconciliation of equity In mil
- Page 177 and 178:
175 Reconciliation of equity In mil
- Page 179 and 180:
177 Reconciliation of equity In mil
- Page 181 and 182:
179 Material adjustments reconcilin
- Page 183 and 184:
181 44. Explanation of transition t
- Page 185 and 186:
183 Statement of value added For th
- Page 187 and 188:
185 Five-Year Financial Summary IFR
- Page 189 and 190:
187 IFRS 31 December 2011 NGAAP Ban
- Page 191 and 192:
189 Investor Information UBA is one
- Page 193 and 194:
191 Top ten shareholders as at 31 D
- Page 195 and 196:
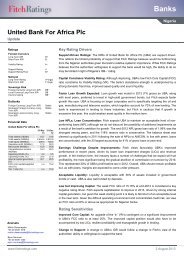
193 Credit rating summary As of 31
- Page 197 and 198:
195 Key Ratio Capital adequacy rati
- Page 199:
Shareholder Data Form United Bank f
- Page 203:
E-Share Allotment Mandate Form Unit
- Page 207:
Admission Form United Bank for Afri
- Page 211 and 212:
209 Corporate Information Registere
- Page 214:
AFRICA LONDON NEW YORK PARIS Head o