SCIENCE REVIEW 1987 - Bedford Institute of Oceanography
SCIENCE REVIEW 1987 - Bedford Institute of Oceanography
SCIENCE REVIEW 1987 - Bedford Institute of Oceanography

Create successful ePaper yourself
Turn your PDF publications into a flip-book with our unique Google optimized e-Paper software.
same all year but moves close to then away<br />
from our instrument bringing faster then<br />
slower regions <strong>of</strong> the current to the<br />
instrument. We know this is probably not<br />
the reason because <strong>of</strong> an interesting fact.<br />
Sea level changes from one side <strong>of</strong> an<br />
ocean current to the other. This fact is<br />
similar to the phenomenon reported daily<br />
in the weather forecasts which tell us how<br />
the atmospheric pressure is changing as the<br />
currents <strong>of</strong> air pass over our heads. The sea<br />
level change associated with the pressure<br />
change across a current <strong>of</strong> water is small<br />
but measurable. Across the strongest<br />
currents in the ocean such as the Gulf<br />
Stream the sea level changes by about one<br />
metre. Across the Labrador Current the<br />
change is only about 15 centimetres, but<br />
that is enough to be calculated using sea<br />
level observations at the shore and temperature<br />
and salinity measurements from the<br />
other side <strong>of</strong> the current in the middle <strong>of</strong><br />
the Labrador Sea. Temperature affects sea<br />
level in the middle <strong>of</strong> the ocean because,<br />
like most other substances, it expands with<br />
heating. The salinity <strong>of</strong> the water also<br />
affects the height <strong>of</strong> sea level. Higher<br />
salinity like cooling makes the water denser<br />
which reduces the sea level.<br />
By doing these calculations we find that<br />
the sea level goes up and down with the<br />
seasons at the shore and in the middle <strong>of</strong><br />
the Labrador Sea but that it goes up and<br />
down more at the shore than in the middle<br />
<strong>of</strong> the sea. From this we conclude that the<br />
sea level, or pressure, drop across the<br />
Current varies throughout the year. This<br />
indicates that the speed <strong>of</strong> the current must<br />
be changing with the seasons just as the<br />
current meter observations in Figure 4<br />
indicated. We therefore conclude that the<br />
strength <strong>of</strong> the current really does change<br />
through the year but what makes it<br />
change?<br />
One reason is found in our observation<br />
that the sea level goes up and down more<br />
near the shore than in the open ocean. Our<br />
measurements <strong>of</strong> temperature and salinity<br />
from these areas show that the sea level<br />
goes up in summer partly because the<br />
water is warmer but this effect is about the<br />
same on both sides <strong>of</strong> the current. Sea level<br />
also goes up in summer because <strong>of</strong> the<br />
increased amount <strong>of</strong> fresh water being<br />
mixed into the seawater. The fresh water is<br />
from the spring melting on land and sea<br />
and is carried to the Labrador Current by<br />
the rivers emptying along the the Labrador<br />
coast and into Hudson Bay, Foxe Basin,<br />
Baffin Bay. Much <strong>of</strong> the fresh water comes<br />
from the Arctic Ocean via the currents<br />
around Greenland but this flow probably<br />
takes more than a year. Unlike the temperature<br />
effect the sea level rise due to the<br />
fresh water is much greater over the<br />
continental shelf than over the open ocean<br />
because it tends to be confined there by the<br />
current. This uneven rise and fall between<br />
the waters over the shelf and open ocean<br />
gives rise to the annual variation in sea<br />
level across the current. We tentatively<br />
conclude, therefore, that the annual variation<br />
in the speed <strong>of</strong> the current is mainly<br />
due to the annual cycle in fresh water flow.<br />
The fact that the maximum flow occurs<br />
late in the year is because the fresh water<br />
has to come a long way and only moves at<br />
about 20 cm s -l .<br />
Another thing we would like to know<br />
about the annual cycle is how constant it is<br />
difference between the minimum and the<br />
maximum current over the year, is about<br />
the same from year to year. The timing <strong>of</strong><br />
the winter decrease, however, changes<br />
dramatically from year to year.<br />
Every year, for example, the speed goes<br />
from its highest values to its lowest values<br />
in winter, but in one year the drop occurs<br />
around Christmas and in another it occurs<br />
three months later at the end <strong>of</strong> March.<br />
This seems like a large change from one<br />
year to the next but so far we don’t know<br />
what causes it or what the consequences<br />
are. Maybe the drop in the current speed in<br />
the winter has something to do with freezeup<br />
in the north and the shift from one year<br />
to the next occurs because freeze-up comes<br />
at different times. This, <strong>of</strong> course, is just<br />
speculation but continued study in the<br />
years ahead will help us to understand how<br />
these changes are connected with climatic<br />
changes in other parts <strong>of</strong> the world and<br />
with the changes in the local fishery.<br />
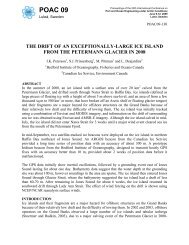
Figure 5 Monthly temperature at 200m depth west <strong>of</strong> Hamilton Bank, showing that from late 1982<br />
through 1985 temperature was about 1°C colder than during the rest <strong>of</strong> the record<br />
from year to year. Does the current, for<br />
example, always have the same maximum<br />
and is it always reached on the same date?<br />
The curves in Figure 4 show the speed <strong>of</strong><br />
the current in summer to vary somewhat<br />
but to be more or less the same from year<br />
to year. In winter the current is seldom the<br />
same. In February for instance the curves<br />
show the smoothed current as low as 5<br />
centimetres per second (cm s -l ) and as high<br />
as 25 cm s -l , but in July the range is only<br />
about 5 cm s -1 . This difference from<br />
summer to winter in the year to year<br />
variation on a particular date has more to<br />
do with the phase or timing <strong>of</strong> the cycle<br />
than with its amplitude. The amplitude, or<br />
Temperature Changes<br />
Over the years we have also been lucky to<br />
observe a large shift in the temperature <strong>of</strong><br />
the water over the Labrador shelf. This was<br />
measured close to the bottom in 200<br />
metres <strong>of</strong> water on the western side <strong>of</strong><br />
Hamilton Bank. These data are shown in<br />
Figure 5 as a series <strong>of</strong> monthly anomalies.<br />
The point for January 1980 is the monthly<br />
mean for that month subtracted from the<br />
mean <strong>of</strong> all the Januarys in the record. This<br />
presentation emphasizes long term departures<br />
from the average. The temperature<br />
clearly was much higher, relative to the<br />
average, during the first two years than in<br />
the period between the autumns <strong>of</strong> 1982<br />
31