- Page 2:
Improving AgriculturalProductivity
- Page 5:
Bangladeshi experiences with a drum
- Page 8:
AcknowledgmentsIRRI is most gratefu
- Page 12 and 13:
The High Barind Tract: a challengin
- Page 14 and 15:
irrigation across the entire Barind
- Page 16:
Workshop synthesis
- Page 19 and 20:
and, with representatives from the
- Page 21 and 22:
Subsistence pressureLand pressure,
- Page 23 and 24:
HerbicidesEarlier efforts to introd
- Page 25 and 26:
volume). PVS is an effective way to
- Page 27 and 28:
Farmers may use wet-seeded DSR as a
- Page 29 and 30:
process and distributing HNPV to fa
- Page 31 and 32:
an NGO, have successfully collabora
- Page 34 and 35:
Workshop discussionParticipants dis
- Page 36 and 37:
How can we identify a short-duratio
- Page 38 and 39:
to fixed tenancy. The implication i
- Page 40:
Opportunities for improving ricepro
- Page 43 and 44:
that the reliability and productivi
- Page 45 and 46:
Table 1. Planting dates, direct-see
- Page 47 and 48:
Table 2. (A) Mean effect of fertili
- Page 49 and 50:
Table 5. On-farm trials of a drum s
- Page 51 and 52:
Upper toposequenceYield (t ha -1 )7
- Page 53 and 54: and perennial grasses (e.g., Ischae
- Page 56 and 57: Direct-seeded rice in the HighBarin
- Page 58: Table 1. Sample selection for costs
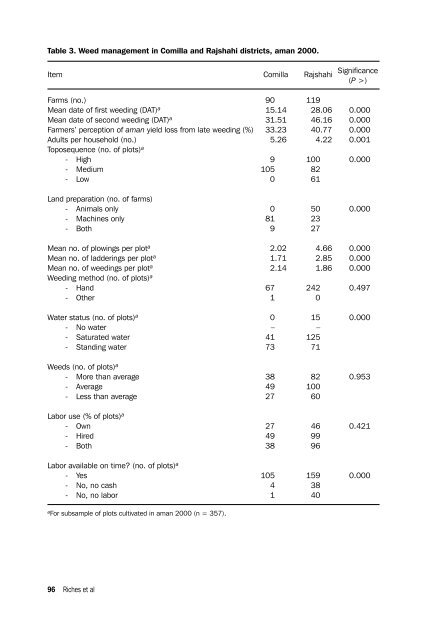
- Page 61 and 62: Table 4. Variations in weed managem
- Page 63 and 64: Table 7. Labor requirements (days h
- Page 65 and 66: Table 10. Farmer perceptions of dis
- Page 67 and 68: Farmers (no.)1412108DSRWet-seededDr
- Page 69 and 70: able commercially. Other OFT farmer
- Page 71: Box 1. Farmers’ comments on DSRPo
- Page 74: NotesAuthors’ addresses: M.A. Jab
- Page 78 and 79: This paper explores the role of som
- Page 80 and 81: (Olsen method, atomic absorption),
- Page 82 and 83: Mean biomass (g m −2 )1,000.000Fi
- Page 84 and 85: Fig. 3. Log rank abundance of weed
- Page 86 and 87: attested by Fig. 2). Diversity in t
- Page 88 and 89: Bangladeshi experiences with a drum
- Page 90 and 91: Table 1. Grain yield and crop durat
- Page 92 and 93: Table 5. Grain yield and growth dur
- Page 94 and 95: ACEy = 0.0001x + 0.7089Yield (t ha
- Page 96 and 97: Table 11. Partial budget analysis f
- Page 98: ConclusionsDirect wet-seeded rice u
- Page 101 and 102: A 178% increase in rice production
- Page 103: Table 1. Components of yield gaps d
- Page 107 and 108: Table 5. Weed management practices
- Page 109 and 110: Table 7. Significance (P H o ) of t
- Page 111 and 112: Since 2000, there has been an incre
- Page 114 and 115: Identifying varieties for the High
- Page 116 and 117: Table 1. Rice varieties bred by cli
- Page 118 and 119: Table 2. Grain yield advantage of J
- Page 120 and 121: Table 3. Plant height and crop dura
- Page 122 and 123: Table 6. Summary of adoption and sp
- Page 124 and 125: Freeman GH, Perkins J.M. 1971. Envi
- Page 126: Opportunities for improving rabi cr
- Page 129 and 130: Grain yield (t ha -1 )2.0npp1.5LSD
- Page 131 and 132: In each of the plots, numbers of He
- Page 133 and 134: Table 2. Effect of IPM components o
- Page 135 and 136: Unit plot size was 10 10 m and the
- Page 137 and 138: Yield (t ha -1 )5Straw4321GrainP (g
- Page 139 and 140: Nodulation score3AControl Soil Mo P
- Page 141 and 142: even at low levels of production. B
- Page 144 and 145: Integration of chickpea and other r
- Page 146 and 147: Grain yield (t ha -1 )3.02.51989-99
- Page 148 and 149: Improved Improved Rainfed rainfed C
- Page 150 and 151: Table 1. Preharvest and postharvest
- Page 152 and 153: Greater resistance to Helicoverpa p
- Page 154 and 155:
wheat varieties). There is also sco
- Page 156 and 157:
Developing seed systems fordissemin
- Page 158 and 159:
This paper describes attempts to em
- Page 160 and 161:
seed needed to attain the recommend
- Page 162 and 163:
introduced to permit sale beyond th
- Page 164:
pesticides, inoculation with benefi
- Page 168 and 169:
for the rabi crop in 2001. Hence, b
- Page 170:
where farmers decided not to relay-
- Page 174 and 175:
Table 2. Mean dates of T. aman harv
- Page 176 and 177:
Table 4. Subsistence pressure and r
- Page 178 and 179:
Table 7. Subsistence pressure and r
- Page 180 and 181:
cite the absence of rent as a facto
- Page 182 and 183:
abi cropping in the HBT through ear
- Page 184 and 185:
Formulation and dissemination ofimp
- Page 186 and 187:
in India, for which shorter-duratio
- Page 188 and 189:
Applied researchOFTsAdaptive resear
- Page 190 and 191:
Table 1. Recommended package of pra
- Page 192 and 193:
Table 2. Grain yields (kg ha -1 ) o
- Page 194 and 195:
Table 4. Grain yields (t ha -1 ) of
- Page 196 and 197:
Table 6. Mean grain yields (t ha -1
- Page 198:
constraints present. This in itself
- Page 202 and 203:
Extending rabi cropping in rice fal
- Page 204 and 205:
Table 1. Estimates of rice area dur
- Page 206 and 207:
Yield (kg ha -1 )1,2001,00080060040
- Page 208 and 209:
Future disseminationThrough dialogu
- Page 210 and 211:
Direct seeding of rice andopportuni
- Page 212 and 213:
Table 1. Time of establishment and
- Page 214 and 215:
Table 3. Weed density and biomass a
- Page 216 and 217:
than in Central Java and many farme
- Page 218 and 219:
Proportion abundance (log scale)Ran
- Page 220 and 221:
CAN FIELD BE DRAINED?YesCAN FIELD B
- Page 222 and 223:
Johnson DE, Mortimer AM. 2005. Issu
- Page 224:
Zhao DL, Atlin GN, Bastiaans L, Spi