Finding Potential Sites for Small-Scale Hydro Power in Uganda: a ...
Finding Potential Sites for Small-Scale Hydro Power in Uganda: a ...
Finding Potential Sites for Small-Scale Hydro Power in Uganda: a ...

Create successful ePaper yourself
Turn your PDF publications into a flip-book with our unique Google optimized e-Paper software.
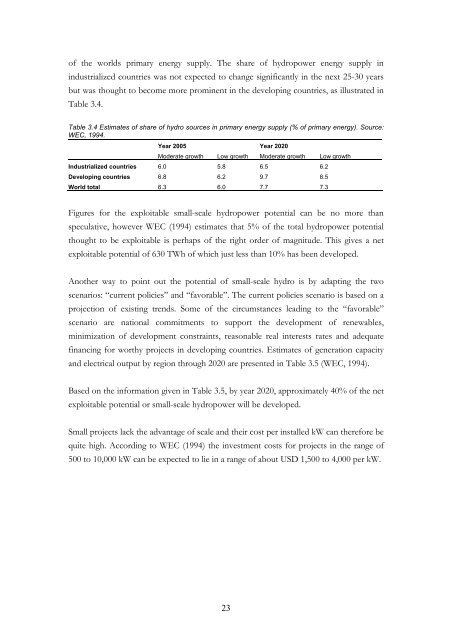
of the worlds primary energy supply. The share of hydropower energy supply <strong>in</strong><strong>in</strong>dustrialized countries was not expected to change significantly <strong>in</strong> the next 25-30 yearsbut was thought to become more prom<strong>in</strong>ent <strong>in</strong> the develop<strong>in</strong>g countries, as illustrated <strong>in</strong>Table 3.4.Table 3.4 Estimates of share of hydro sources <strong>in</strong> primary energy supply (% of primary energy). Source:WEC, 1994.Year 2005 Year 2020Moderate growth Low growth Moderate growth Low growthIndustrialized countries 6.0 5.8 6.5 6.2Develop<strong>in</strong>g countries 6.8 6.2 9.7 8.5World total 6.3 6.0 7.7 7.3Figures <strong>for</strong> the exploitable small-scale hydropower potential can be no more thanspeculative, however WEC (1994) estimates that 5% of the total hydropower potentialthought to be exploitable is perhaps of the right order of magnitude. This gives a netexploitable potential of 630 TWh of which just less than 10% has been developed.Another way to po<strong>in</strong>t out the potential of small-scale hydro is by adapt<strong>in</strong>g the twoscenarios: “current policies” and “favorable”. The current policies scenario is based on aprojection of exist<strong>in</strong>g trends. Some of the circumstances lead<strong>in</strong>g to the “favorable”scenario are national commitments to support the development of renewables,m<strong>in</strong>imization of development constra<strong>in</strong>ts, reasonable real <strong>in</strong>terests rates and adequatef<strong>in</strong>anc<strong>in</strong>g <strong>for</strong> worthy projects <strong>in</strong> develop<strong>in</strong>g countries. Estimates of generation capacityand electrical output by region through 2020 are presented <strong>in</strong> Table 3.5 (WEC, 1994).Based on the <strong>in</strong><strong>for</strong>mation given <strong>in</strong> Table 3.5, by year 2020, approximately 40% of the netexploitable potential or small-scale hydropower will be developed.<strong>Small</strong> projects lack the advantage of scale and their cost per <strong>in</strong>stalled kW can there<strong>for</strong>e bequite high. Accord<strong>in</strong>g to WEC (1994) the <strong>in</strong>vestment costs <strong>for</strong> projects <strong>in</strong> the range of500 to 10,000 kW can be expected to lie <strong>in</strong> a range of about USD 1,500 to 4,000 per kW.23