Finding Potential Sites for Small-Scale Hydro Power in Uganda: a ...
Finding Potential Sites for Small-Scale Hydro Power in Uganda: a ...
Finding Potential Sites for Small-Scale Hydro Power in Uganda: a ...

Create successful ePaper yourself
Turn your PDF publications into a flip-book with our unique Google optimized e-Paper software.
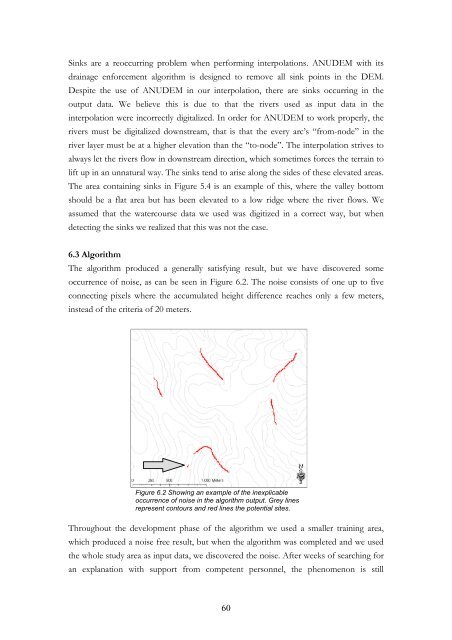
S<strong>in</strong>ks are a reoccurr<strong>in</strong>g problem when per<strong>for</strong>m<strong>in</strong>g <strong>in</strong>terpolations. ANUDEM with itsdra<strong>in</strong>age en<strong>for</strong>cement algorithm is designed to remove all s<strong>in</strong>k po<strong>in</strong>ts <strong>in</strong> the DEM.Despite the use of ANUDEM <strong>in</strong> our <strong>in</strong>terpolation, there are s<strong>in</strong>ks occurr<strong>in</strong>g <strong>in</strong> theoutput data. We believe this is due to that the rivers used as <strong>in</strong>put data <strong>in</strong> the<strong>in</strong>terpolation were <strong>in</strong>correctly digitalized. In order <strong>for</strong> ANUDEM to work properly, therivers must be digitalized downstream, that is that the every arc’s “from-node” <strong>in</strong> theriver layer must be at a higher elevation than the “to-node”. The <strong>in</strong>terpolation strives toalways let the rivers flow <strong>in</strong> downstream direction, which sometimes <strong>for</strong>ces the terra<strong>in</strong> tolift up <strong>in</strong> an unnatural way. The s<strong>in</strong>ks tend to arise along the sides of these elevated areas.The area conta<strong>in</strong><strong>in</strong>g s<strong>in</strong>ks <strong>in</strong> Figure 5.4 is an example of this, where the valley bottomshould be a flat area but has been elevated to a low ridge where the river flows. Weassumed that the watercourse data we used was digitized <strong>in</strong> a correct way, but whendetect<strong>in</strong>g the s<strong>in</strong>ks we realized that this was not the case.6.3 AlgorithmThe algorithm produced a generally satisfy<strong>in</strong>g result, but we have discovered someoccurrence of noise, as can be seen <strong>in</strong> Figure 6.2. The noise consists of one up to fiveconnect<strong>in</strong>g pixels where the accumulated height difference reaches only a few meters,<strong>in</strong>stead of the criteria of 20 meters.Figure 6.2 Show<strong>in</strong>g an example of the <strong>in</strong>explicableoccurrence of noise <strong>in</strong> the algorithm output. Grey l<strong>in</strong>esrepresent contours and red l<strong>in</strong>es the potential sites.Throughout the development phase of the algorithm we used a smaller tra<strong>in</strong><strong>in</strong>g area,which produced a noise free result, but when the algorithm was completed and we usedthe whole study area as <strong>in</strong>put data, we discovered the noise. After weeks of search<strong>in</strong>g <strong>for</strong>an explanation with support from competent personnel, the phenomenon is still60