Finding Potential Sites for Small-Scale Hydro Power in Uganda: a ...
Finding Potential Sites for Small-Scale Hydro Power in Uganda: a ...
Finding Potential Sites for Small-Scale Hydro Power in Uganda: a ...
Create successful ePaper yourself
Turn your PDF publications into a flip-book with our unique Google optimized e-Paper software.
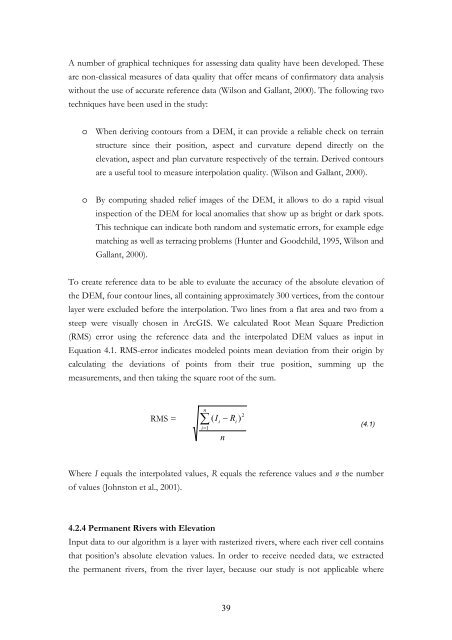
A number of graphical techniques <strong>for</strong> assess<strong>in</strong>g data quality have been developed. Theseare non-classical measures of data quality that offer means of confirmatory data analysiswithout the use of accurate reference data (Wilson and Gallant, 2000). The follow<strong>in</strong>g twotechniques have been used <strong>in</strong> the study:o When deriv<strong>in</strong>g contours from a DEM, it can provide a reliable check on terra<strong>in</strong>structure s<strong>in</strong>ce their position, aspect and curvature depend directly on theelevation, aspect and plan curvature respectively of the terra<strong>in</strong>. Derived contoursare a useful tool to measure <strong>in</strong>terpolation quality. (Wilson and Gallant, 2000).o By comput<strong>in</strong>g shaded relief images of the DEM, it allows to do a rapid visual<strong>in</strong>spection of the DEM <strong>for</strong> local anomalies that show up as bright or dark spots.This technique can <strong>in</strong>dicate both random and systematic errors, <strong>for</strong> example edgematch<strong>in</strong>g as well as terrac<strong>in</strong>g problems (Hunter and Goodchild, 1995, Wilson andGallant, 2000).To create reference data to be able to evaluate the accuracy of the absolute elevation ofthe DEM, four contour l<strong>in</strong>es, all conta<strong>in</strong><strong>in</strong>g approximately 300 vertices, from the contourlayer were excluded be<strong>for</strong>e the <strong>in</strong>terpolation. Two l<strong>in</strong>es from a flat area and two from asteep were visually chosen <strong>in</strong> ArcGIS. We calculated Root Mean Square Prediction(RMS) error us<strong>in</strong>g the reference data and the <strong>in</strong>terpolated DEM values as <strong>in</strong>put <strong>in</strong>Equation 4.1. RMS-error <strong>in</strong>dicates modeled po<strong>in</strong>ts mean deviation from their orig<strong>in</strong> bycalculat<strong>in</strong>g the deviations of po<strong>in</strong>ts from their true position, summ<strong>in</strong>g up themeasurements, and then tak<strong>in</strong>g the square root of the sum.RMS =n∑i=1( I − R )<strong>in</strong>i2(4.1)Where I equals the <strong>in</strong>terpolated values, R equals the reference values and n the numberof values (Johnston et al., 2001).4.2.4 Permanent Rivers with ElevationInput data to our algorithm is a layer with rasterized rivers, where each river cell conta<strong>in</strong>sthat position’s absolute elevation values. In order to receive needed data, we extractedthe permanent rivers, from the river layer, because our study is not applicable where39


