

6.-March-2011-Saving-Mothers-Lives-reviewing-maternal-deaths-to-make-motherhood-safer-2006-2008
6.-March-2011-Saving-Mothers-Lives-reviewing-maternal-deaths-to-make-motherhood-safer-2006-2008
6.-March-2011-Saving-Mothers-Lives-reviewing-maternal-deaths-to-make-motherhood-safer-2006-2008

You also want an ePaper? Increase the reach of your titles
YUMPU automatically turns print PDFs into web optimized ePapers that Google loves.
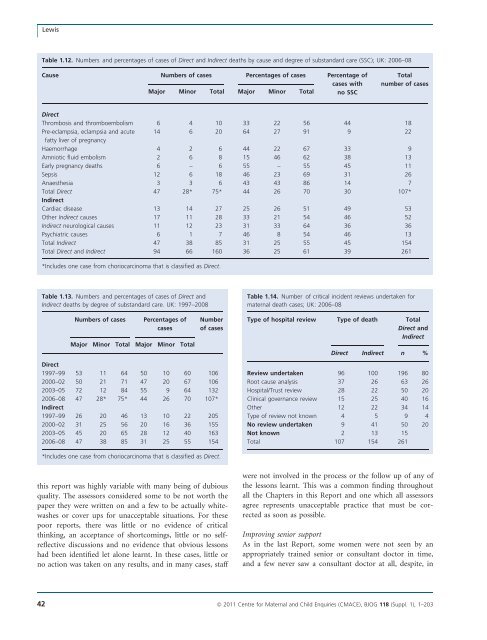
LewisTable 1.12. Numbers and percentages of cases of Direct and Indirect <strong>deaths</strong> by cause and degree of substandard care (SSC); UK: <strong>2006</strong>–08Cause Numbers of cases Percentages of cases Percentage ofcases withMajor Minor Total Major Minor Total no SSCTotalnumber of casesDirectThrombosis and thromboembolism 6 4 10 33 22 56 44 18Pre-eclampsia, eclampsia and acute 14 6 20 64 27 91 9 22fatty liver of pregnancyHaemorrhage 4 2 6 44 22 67 33 9Amniotic fluid embolism 2 6 8 15 46 62 38 13Early pregnancy <strong>deaths</strong> 6 – 6 55 – 55 45 11Sepsis 12 6 18 46 23 69 31 26Anaesthesia 3 3 6 43 43 86 14 7Total Direct 47 28* 75* 44 26 70 30 107*IndirectCardiac disease 13 14 27 25 26 51 49 53Other Indirect causes 17 11 28 33 21 54 46 52Indirect neurological causes 11 12 23 31 33 64 36 36Psychiatric causes 6 1 7 46 8 54 46 13Total Indirect 47 38 85 31 25 55 45 154Total Direct and Indirect 94 66 160 36 25 61 39 261*Includes one case from choriocarcinoma that is classified as Direct.Table 1.13. Numbers and percentages of cases of Direct andIndirect <strong>deaths</strong> by degree of substandard care. UK: 1997–<strong>2008</strong>Table 1.14. Number of critical incident reviews undertaken for<strong>maternal</strong> death cases; UK: <strong>2006</strong>–08Numbers of casesPercentages ofcasesMajor Minor Total Major Minor TotalNumberof casesType of hospital review Type of death TotalDirect andIndirectDirect Indirect n %Direct1997–99 53 11 64 50 10 60 1062000–02 50 21 71 47 20 67 1062003–05 72 12 84 55 9 64 132<strong>2006</strong>–08 47 28* 75* 44 26 70 107*Indirect1997–99 26 20 46 13 10 22 2052000–02 31 25 56 20 16 36 1552003–05 45 20 65 28 12 40 163<strong>2006</strong>–08 47 38 85 31 25 55 154Review undertaken 96 100 196 80Root cause analysis 37 26 63 26Hospital/Trust review 28 22 50 20Clinical governance review 15 25 40 16Other 12 22 34 14Type of review not known 4 5 9 4No review undertaken 9 41 50 20Not known 2 13 15Total 107 154 261*Includes one case from choriocarcinoma that is classified as Direct.this report was highly variable with many being of dubiousquality. The assessors considered some <strong>to</strong> be not worth thepaper they were written on and a few <strong>to</strong> be actually whitewashesor cover ups for unacceptable situations. For thesepoor reports, there was little or no evidence of criticalthinking, an acceptance of shortcomings, little or no selfreflectivediscussions and no evidence that obvious lessonshad been identified let alone learnt. In these cases, little orno action was taken on any results, and in many cases, staffwere not involved in the process or the follow up of any ofthe lessons learnt. This was a common finding throughoutall the Chapters in this Report and one which all assessorsagree represents unacceptable practice that must be correctedas soon as possible.Improving senior supportAs in the last Report, some women were not seen by anappropriately trained senior or consultant doc<strong>to</strong>r in time,and a few never saw a consultant doc<strong>to</strong>r at all, despite, in42 ª <strong>2011</strong> Centre for Maternal and Child Enquiries (CMACE), BJOG 118 (Suppl. 1), 1–203