

6.-March-2011-Saving-Mothers-Lives-reviewing-maternal-deaths-to-make-motherhood-safer-2006-2008
6.-March-2011-Saving-Mothers-Lives-reviewing-maternal-deaths-to-make-motherhood-safer-2006-2008
6.-March-2011-Saving-Mothers-Lives-reviewing-maternal-deaths-to-make-motherhood-safer-2006-2008

You also want an ePaper? Increase the reach of your titles
YUMPU automatically turns print PDFs into web optimized ePapers that Google loves.
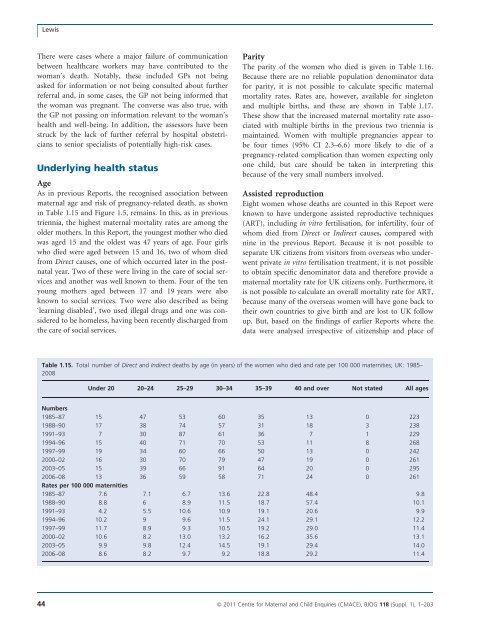
LewisThere were cases where a major failure of communicationbetween healthcare workers may have contributed <strong>to</strong> thewoman’s death. Notably, these included GPs not beingasked for information or not being consulted about furtherreferral and, in some cases, the GP not being informed thatthe woman was pregnant. The converse was also true, withthe GP not passing on information relevant <strong>to</strong> the woman’shealth and well-being. In addition, the assessors have beenstruck by the lack of further referral by hospital obstetricians<strong>to</strong> senior specialists of potentially high-risk cases.Underlying health statusAgeAs in previous Reports, the recognised association between<strong>maternal</strong> age and risk of pregnancy-related death, as shownin Table 1.15 and Figure 1.5, remains. In this, as in previoustriennia, the highest <strong>maternal</strong> mortality rates are among theolder mothers. In this Report, the youngest mother who diedwas aged 15 and the oldest was 47 years of age. Four girlswho died were aged between 15 and 16, two of whom diedfrom Direct causes, one of which occurred later in the postnatalyear. Two of these were living in the care of social servicesand another was well known <strong>to</strong> them. Four of the tenyoung mothers aged between 17 and 19 years were alsoknown <strong>to</strong> social services. Two were also described as being‘learning disabled’, two used illegal drugs and one was considered<strong>to</strong> be homeless, having been recently discharged fromthe care of social services.ParityThe parity of the women who died is given in Table 1.1<strong>6.</strong>Because there are no reliable population denomina<strong>to</strong>r datafor parity, it is not possible <strong>to</strong> calculate specific <strong>maternal</strong>mortality rates. Rates are, however, available for single<strong>to</strong>nand multiple births, and these are shown in Table 1.17.These show that the increased <strong>maternal</strong> mortality rate associatedwith multiple births in the previous two triennia ismaintained. Women with multiple pregnancies appear <strong>to</strong>be four times (95% CI 2.3–<strong>6.</strong>6) more likely <strong>to</strong> die of apregnancy-related complication than women expecting onlyone child, but care should be taken in interpreting thisbecause of the very small numbers involved.Assisted reproductionEight women whose <strong>deaths</strong> are counted in this Report wereknown <strong>to</strong> have undergone assisted reproductive techniques(ART), including in vitro fertilisation, for infertility, four ofwhom died from Direct or Indirect causes, compared withnine in the previous Report. Because it is not possible <strong>to</strong>separate UK citizens from visi<strong>to</strong>rs from overseas who underwentprivate in vitro fertilisation treatment, it is not possible<strong>to</strong> obtain specific denomina<strong>to</strong>r data and therefore provide a<strong>maternal</strong> mortality rate for UK citizens only. Furthermore, itis not possible <strong>to</strong> calculate an overall mortality rate for ART,because many of the overseas women will have gone back <strong>to</strong>their own countries <strong>to</strong> give birth and are lost <strong>to</strong> UK followup. But, based on the findings of earlier Reports where thedata were analysed irrespective of citizenship and place ofTable 1.15. Total number of Direct and Indirect <strong>deaths</strong> by age (in years) of the women who died and rate per 100 000 maternities; UK: 1985–<strong>2008</strong>Under 20 20–24 25–29 30–34 35–39 40 and over Not stated All agesNumbers1985–87 15 47 53 60 35 13 0 2231988–90 17 38 74 57 31 18 3 2381991–93 7 30 87 61 36 7 1 2291994–96 15 40 71 70 53 11 8 2681997–99 19 34 60 66 50 13 0 2422000–02 16 30 70 79 47 19 0 2612003–05 15 39 66 91 64 20 0 295<strong>2006</strong>–08 13 36 59 58 71 24 0 261Rates per 100 000 maternities1985–87 7.6 7.1 <strong>6.</strong>7 13.6 22.8 48.4 9.81988–90 8.8 6 8.9 11.5 18.7 57.4 10.11991–93 4.2 5.5 10.6 10.9 19.1 20.6 9.91994–96 10.2 9 9.6 11.5 24.1 29.1 12.21997–99 11.7 8.9 9.3 10.5 19.2 29.0 11.42000–02 10.6 8.2 13.0 13.2 1<strong>6.</strong>2 35.6 13.12003–05 9.9 9.8 12.4 14.5 19.1 29.4 14.0<strong>2006</strong>–08 8.6 8.2 9.7 9.2 18.8 29.2 11.444 ª <strong>2011</strong> Centre for Maternal and Child Enquiries (CMACE), BJOG 118 (Suppl. 1), 1–203