- Page 1: Volume 118, Supplement 1, March 201
- Page 4 and 5: AcknowledgementsSaving Mothers’ L
- Page 6 and 7: AcknowledgementsAcknowledgementsCMA
- Page 8 and 9: Forewordbeen written jointly by a m
- Page 10 and 11: ‘Top ten’ recommendationsServic
- Page 12 and 13: ‘Top ten’ recommendationscommun
- Page 14 and 15: ‘Top ten’ recommendationsof suc
- Page 16 and 17: ‘Top ten’ recommendationsMarch
- Page 18 and 19: Oates et al.Back to basicsM Oates 1
- Page 20 and 21: Oates et al.BreathlessnessBreathles
- Page 22 and 23: Oates et al.appropriate pathway of
- Page 24 and 25: LewisIntroduction: Aims, objectives
- Page 26 and 27: LewisAn important limitation of ran
- Page 28 and 29: Lewismaternal and public health-pol
- Page 30 and 31: Lewisresult in a live birth at any
- Page 32 and 33: LewisChapter 1: The women who died
- Page 34 and 35: Lewiswho would not have been identi
- Page 36 and 37: Lewis1098Rate per 100 000 materniti
- Page 38 and 39: LewisTable 1.4. Numbers and rates o
- Page 40 and 41: Lewis2.50Rate per 100 000 materniti
- Page 42 and 43: LewisTable 1.9. Number of maternal
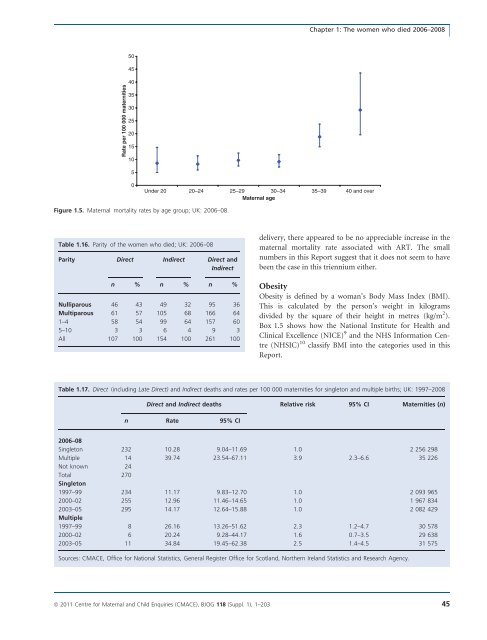
- Page 44 and 45: LewisTable 1.12. Numbers and percen
- Page 48 and 49: LewisBox 1.5. Classifications of Bo
- Page 50 and 51: LewisTable 1.20. Number and estimat
- Page 52 and 53: LewisNew countries of the European
- Page 54 and 55: LewisTable 1.23. Direct and Indirec
- Page 56 and 57: LewisTable 1.26. Characteristics* o
- Page 58 and 59: Lewis4 Lewis G (ed). The Confidenti
- Page 60 and 61: DrifeTable 2.1. Direct deaths from
- Page 62 and 63: Drifewomen who died in 2006-08 had
- Page 64 and 65: Drifedelivery she became breathless
- Page 66 and 67: DrifePathological overviewFourteen
- Page 68 and 69: NeilsonChapter 3: Pre-eclampsia and
- Page 70 and 71: Neilsontrue, and what might be the
- Page 72 and 73: NeilsonConclusionThe number of deat
- Page 74 and 75: NormanBackgroundIn the UK, major ob
- Page 76 and 77: Normanwhich there was catastrophic
- Page 78 and 79: Normanrecommendations made in succe
- Page 80 and 81: DawsonBox 5.1. The UK amniotic flui
- Page 82 and 83: Dawsontry despite an extensive sear
- Page 84 and 85: O’HerlihyTable 6.1. Numbers of Di
- Page 86 and 87: O’Herlihytoxic shock syndrome aft
- Page 88 and 89: HarperGroup A b-haemolytic streptoc
- Page 90 and 91: Harperthe 6-week postnatal period,
- Page 92 and 93: Harpera major intrapartum haemorrha
- Page 94 and 95: HarperBox 7.1. Signs and symptoms o
- Page 96 and 97:
Harperwoman was given several litre
- Page 98 and 99:
Harper2 Lamagni TL, Efstratiou A, D
- Page 100 and 101:
LucasTable A7.1 Proposed new catego
- Page 102 and 103:
Lucasthe same infection scenario as
- Page 104 and 105:
McClure, CooperChapter 8: Anaesthes
- Page 106 and 107:
McClure, Cooperaddress, but protoco
- Page 108 and 109:
McClure, CooperPostpartum haemorrha
- Page 110 and 111:
McClure, CooperWorkloadA number of
- Page 112 and 113:
Nelson-PiercyTable 9.1. Indirect ma
- Page 114 and 115:
Nelson-Piercynary arteries. In view
- Page 116 and 117:
Nelson-Piercynormal left ventricle
- Page 118 and 119:
LucasAnnex 9.1. Pathological overvi
- Page 120 and 121:
Lucasdiac death that is non-ischaem
- Page 122 and 123:
de Swiet et al.causes but are aggra
- Page 124 and 125:
de Swiet et al.died of SUDEP before
- Page 126 and 127:
de Swiet et al.for 6 weeks after de
- Page 128 and 129:
de Swiet et al.mised. The obstetric
- Page 130 and 131:
de Swiet et al.CancerPregnancy does
- Page 132 and 133:
de Swiet et al.a thorough autopsy w
- Page 134 and 135:
Oates, CantwellChapter 11: Deaths f
- Page 136 and 137:
Oates, CantwellTable 11.1. Timing o
- Page 138 and 139:
Oates, CantwellTable 11.5. Maternal
- Page 140 and 141:
Oates, CantwellChild protection iss
- Page 142 and 143:
Oates, CantwellAll women who are su
- Page 144 and 145:
Oates, Cantwell4 Kendel RE, Chalmer
- Page 146 and 147:
Lewismaternal mortality rates or ra
- Page 148 and 149:
Annex 12.1. Domestic abuseAnnex 12.
- Page 150 and 151:
Annex 12.1. Domestic abuseshe could
- Page 152 and 153:
Garrod et al.supportive but challen
- Page 154 and 155:
Garrod et al.• Culture and system
- Page 156 and 157:
Garrod et al.the second stage and s
- Page 158 and 159:
Garrod et al.through the still heal
- Page 160 and 161:
ShakespeareChapter 14: General prac
- Page 162 and 163:
Shakespeareemergency caesarean sect
- Page 164 and 165:
ShakespeareCardiac diseaseDeaths fr
- Page 166 and 167:
Shakespearereduce the risks to the
- Page 168 and 169:
ShakespeareManaging a maternal deat
- Page 170 and 171:
Hulbertin the ED was of a high qual
- Page 172 and 173:
HulbertPre-eclampsia/eclampsia: lea
- Page 174 and 175:
HulbertTransfersWhen the obstetric
- Page 176 and 177:
Clutton-Brocksimply the case that s
- Page 178 and 179:
Clutton-BrockDiagnosis of sepsisTak
- Page 180 and 181:
Clutton-Brockpulseless electrical a
- Page 182 and 183:
Clutton-BrockImprovement Scotland (
- Page 184 and 185:
Lucas, Millward-Sadler95 mmHg. This
- Page 186 and 187:
Lucas, Millward-Sadleran agreed mai
- Page 188 and 189:
Annex 17.1. The main clinico-tholog
- Page 190 and 191:
MillerAppendix 1: The method of Enq
- Page 192 and 193:
MillerDatanotificationNotificationR
- Page 194 and 195:
Knight• investigating different m
- Page 196 and 197:
Knightbaseline incidence against wh
- Page 198 and 199:
LennoxAppendix 2B: Summary of Scott
- Page 200 and 201:
LennoxEvidence of effective managem
- Page 202 and 203:
Appendix 3: Contributors to the Mat
- Page 204 and 205:
Appendix 3: Contributors to the Mat