5.1 Table 5.1 Key statistics on operating characteristics of the telecommunications industry (cont'd)HK$ million (unless otherwise specified)1997 2002 2003 2004 2005 2006 2007Radio paging and othertelecommunications services 160 387 336 330 273 251 243Number of establishments 9 485 7 461 6 938 6 664 7 003 7 793 7 044Number of persons engaged 1,938 2,254 2,005 1,814 2,048 2,319 2,166Compensation of employees 3,982 8,489 8,313 11,182 13,428 13,854 15,281Operating expenses 8,294 12,191 12,069 13,330 16,645 19,428 20,614Business receipts andother income 3,420 3,193 3,546 2,313 2,720 4,902 4,812Value addedOverall 173 400 351 345 287 265 258Number of establishments 31 136 21 243 21 512 17 887 18 303 18 191 17 603Number of persons engaged 8,847 6,286 6,234 4,966 5,276 5,339 5,147Compensation of employees 29,962 24,588 24,908 28,731 30,875 31,043 33,721Operating expenses 62,012 49,516 47,977 49,705 52,242 54,159 57,510Business receipts andother income 24,524 23,129 21,025 17,151 18,262 19,997 21,170Value addedSource: Business Services Statistics Section, Census and Statistics Department82 Hong Kong as an Information Society 2009
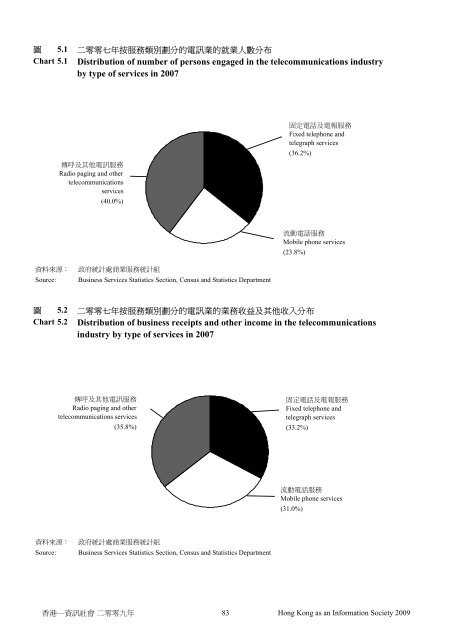
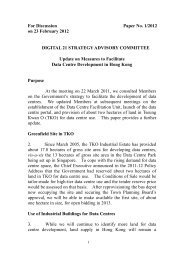
5.1 Chart 5.1 Distribution of number of persons engaged in the telecommunications industryby type of services in 2007Radio paging and othertelecommunicationsservices(40.0%)Fixed telephone andtelegraph services(36.2%)Mobile phone services(23.8%)Source: Business Services Statistics Section, Census and Statistics Department 5.2 Chart 5.2 Distribution of business receipts and other income in the telecommunicationsindustry by type of services in 2007Radio paging and othertelecommunications services(35.8%)Fixed telephone andtelegraph services(33.2%)Mobile phone services(31.0%)Source: Business Services Statistics Section, Census and Statistics Department83 Hong Kong as an Information Society 2009