香港—資訊社會 - 「數碼21」資訊科技策略
香港—資訊社會 - 「數碼21」資訊科技策略
香港—資訊社會 - 「數碼21」資訊科技策略

Create successful ePaper yourself
Turn your PDF publications into a flip-book with our unique Google optimized e-Paper software.
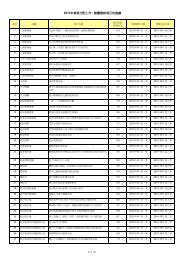
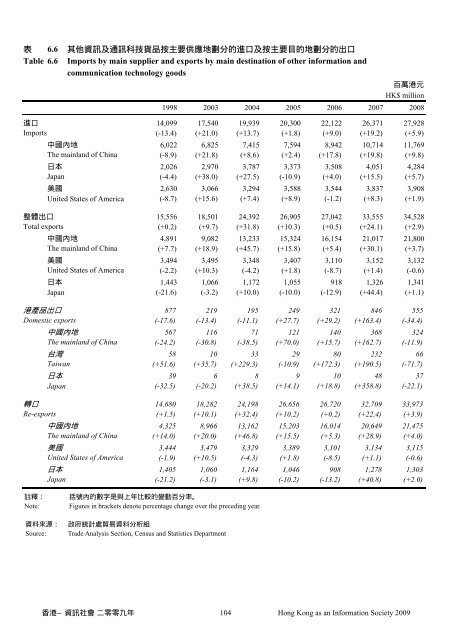
6.6 Table 6.6 Imports by main supplier and exports by main destination of other information andcommunication technology goodsHK$ million1998 2003 2004 2005 2006 2007 2008 14,099 17,540 19,939 20,300 22,122 26,371 27,928Imports (-13.4) (+21.0) (+13.7) (+1.8) (+9.0) (+19.2) (+5.9) 6,022 6,825 7,415 7,594 8,942 10,714 11,769The mainland of China (-8.9) (+21.8) (+8.6) (+2.4) (+17.8) (+19.8) (+9.8) 2,026 2,970 3,787 3,373 3,508 4,051 4,284Japan (-4.4) (+38.0) (+27.5) (-10.9) (+4.0) (+15.5) (+5.7) 2,630 3,066 3,294 3,588 3,544 3,837 3,908United States of America (-8.7) (+15.6) (+7.4) (+8.9) (-1.2) (+8.3) (+1.9) 15,556 18,501 24,392 26,905 27,042 33,555 34,528Total exports (+0.2) (+9.7) (+31.8) (+10.3) (+0.5) (+24.1) (+2.9) 4,891 9,082 13,233 15,324 16,154 21,017 21,800The mainland of China (+7.7) (+18.9) (+45.7) (+15.8) (+5.4) (+30.1) (+3.7) 3,494 3,495 3,348 3,407 3,110 3,152 3,132United States of America (-2.2) (+10.3) (-4.2) (+1.8) (-8.7) (+1.4) (-0.6) 1,443 1,066 1,172 1,055 918 1,326 1,341Japan (-21.6) (-3.2) (+10.0) (-10.0) (-12.9) (+44.4) (+1.1) 877 219 195 249 321 846 555Domestic exports (-17.6) (-13.4) (-11.1) (+27.7) (+29.2) (+163.4) (-34.4) 567 116 71 121 140 368 324The mainland of China (-24.2) (-30.8) (-38.5) (+70.0) (+15.7) (+162.7) (-11.9) 58 10 33 29 80 232 66Taiwan (+51.6) (+35.7) (+229.3) (-10.9) (+172.3) (+190.5) (-71.7) 39 6 8 9 10 48 37Japan (-32.5) (-20.2) (+38.5) (+14.1) (+18.8) (+358.8) (-22.1) 14,680 18,282 24,198 26,656 26,720 32,709 33,973Re-exports (+1.5) (+10.1) (+32.4) (+10.2) (+0.2) (+22.4) (+3.9) 4,325 8,966 13,162 15,203 16,014 20,649 21,475The mainland of China (+14.0) (+20.0) (+46.8) (+15.5) (+5.3) (+28.9) (+4.0) 3,444 3,479 3,329 3,389 3,101 3,134 3,115United States of America (-1.9) (+10.5) (-4.3) (+1.8) (-8.5) (+1.1) (-0.6) 1,405 1,060 1,164 1,046 908 1,278 1,303Japan (-21.2) (-3.1) (+9.8) (-10.2) (-13.2) (+40.8) (+2.0) Note: Figures in brackets denote percentage change over the preceding year.Source: Trade Analysis Section, Census and Statistics Department104 Hong Kong as an Information Society 2009