- Page 1:
Hong Kong as an Information Society
- Page 5 and 6:
Contents List of Tables ii List of
- Page 7 and 8:
1.101.111.121.131.141.151.161.171.1
- Page 9 and 10:
2.7B2.8A2.8B2.9A2.9BTable 2.7B Perc
- Page 11 and 12:
Page4. 4. Operating Characteristics
- Page 13 and 14:
8.5B8.68.7Table 8.5B Number of teac
- Page 15 and 16:
IntroductionThis publication aims a
- Page 17 and 18:
Latest Statistics on Core Informati
- Page 19 and 20:
Latest Statistics on Core ICT Indic
- Page 22 and 23:
1.4 着 1.4 Following the rapid de
- Page 24 and 25:
Economic activity status1.13 1.13 A
- Page 26 and 27:
1.21 3 935 900 1.21 Some 3 935 900
- Page 28 and 29:
Type of electronic business service
- Page 30 and 31:
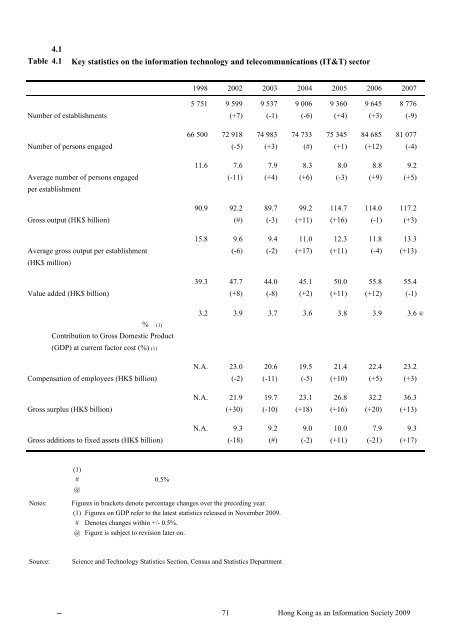
1.1 Table 1.1 Key statistics on inf
- Page 32 and 33:
1.3 Table 1.3 Number of persons age
- Page 34 and 35:
1.5 Table 1.5 Number of persons age
- Page 36 and 37:
1.8 Table 1.8 Number of persons age
- Page 38 and 39:
1.10 Table 1.10 Number of persons a
- Page 40 and 41: 1.12 Table 1.12 Number of persons a
- Page 42 and 43: 1.14 Table 1.14 Number of persons a
- Page 44 and 45: 1.16 Table 1.16 Number of persons a
- Page 46 and 47: 1.18 Table 1.18 Number of persons a
- Page 48 and 49: Personal Computer Usage2.4 2.4 Acco
- Page 50 and 51: (a) (a) Order or purchase of goods,
- Page 52 and 53: 2.21 2.21 The value of business rec
- Page 54 and 55: 2.1 Table 2.1 Key statistics on usa
- Page 56 and 57: 2.2B Table 2.2B Percentage of estab
- Page 58 and 59: 2.3B Table 2.3B Percentage of estab
- Page 60 and 61: 2.4 Table 2.4 Distribution of estab
- Page 62 and 63: 2.5B Table 2.5B Distribution of est
- Page 64 and 65: 2.6B Table 2.6B Percentage of estab
- Page 66 and 67: 2.7BTable 2.7BPercentage of establi
- Page 68 and 69: 2.8B Table 2.8B Percentage of estab
- Page 70 and 71: 2.9B Table 2.9B Number of establish
- Page 72 and 73: 2.10B Table 2.10B Percentage of est
- Page 74 and 75: 2.11B Table 2.11B Number of establi
- Page 76 and 77: 2.12B Table 2.12B Number of establi
- Page 78 and 79: 2.14 Table 2.14 Business receipts r
- Page 80 and 81: 2.16 Table 2.16 Distribution of est
- Page 83 and 84: 3 Chapter 3Information Technology U
- Page 85: 3.2 Table 3.2 Computerisation in th
- Page 88 and 89: Industry Structure of the IT&T Sect
- Page 92 and 93: 4.1 Chart 4.1 Distribution of numbe
- Page 95 and 96: 5 Chapter 5Telecommunications Servi
- Page 97 and 98: Fixed Telephone and Telegraph Servi
- Page 99 and 100: Radio Paging and OtherTelecommunica
- Page 101 and 102: 5.1 Table 5.1 Key statistics on ope
- Page 103 and 104: 5.1 Chart 5.1 Distribution of numbe
- Page 105 and 106: 5.2 Table 5.2 Wireline telephone se
- Page 107 and 108: 5.3 Table 5.3 Public mobile service
- Page 109 and 110: 5.4 Table 5.4 Public radio paging s
- Page 111 and 112: 5.5 Table 5.5 External telecommunic
- Page 113 and 114: 5.6 Table 5.6 Internet services (co
- Page 115 and 116: 6 Chapter 6Imports and Exports of I
- Page 117 and 118: 6.11 6.11 In 2008, the mainland of
- Page 119 and 120: 6.1 (1)Table 6.1 Imports by main su
- Page 121 and 122: 6.3 Table 6.3 Imports by main suppl
- Page 123 and 124: 6.5 Table 6.5 Imports by main suppl
- Page 125 and 126: 7 Chapter 7Human Resources in Infor
- Page 127 and 128: 7.1A Table 7.1A Manpower structure
- Page 129 and 130: 7.1 Chart 7.1 Manpower structure of
- Page 131: 7.2 Chart 7.2 Distribution of infor
- Page 134 and 135: 8.6 8.6 The student enrolment (incl
- Page 136 and 137: (3) (3) In the 2008/09 school year,
- Page 138 and 139: 8.2 Table 8.2 Student intake of inf
- Page 140 and 141:
8.4 Table 8.4 Government spending o
- Page 142 and 143:
8.5B Table 8.5B Number of teachers
- Page 145 and 146:
Terms and DefinitionsAppendix A1. 1
- Page 147 and 148:
2.6 2.6 A digital certificate can
- Page 149 and 150:
2.16 2.16 Total expenditure on info
- Page 151 and 152:
5. 5. Telecommunications Services5
- Page 153 and 154:
6.4 6.4 Trade statistics on electro
- Page 155 and 156:
• -• Manager - Customer Engine
- Page 157 and 158:
• • Hardware/Firmware/Software
- Page 159 and 160:
• • Software Assurance Speciali
- Page 161:
- for 2006 and 2008• -• -•
- Page 164 and 165:
ChapterSource of informationEnquiry
- Page 167 and 168:
Appendix D √: 4 : (852) 2842 884


