香港—資訊社會 - 「數碼21」資訊科技策略
香港—資訊社會 - 「數碼21」資訊科技策略
香港—資訊社會 - 「數碼21」資訊科技策略

Create successful ePaper yourself
Turn your PDF publications into a flip-book with our unique Google optimized e-Paper software.
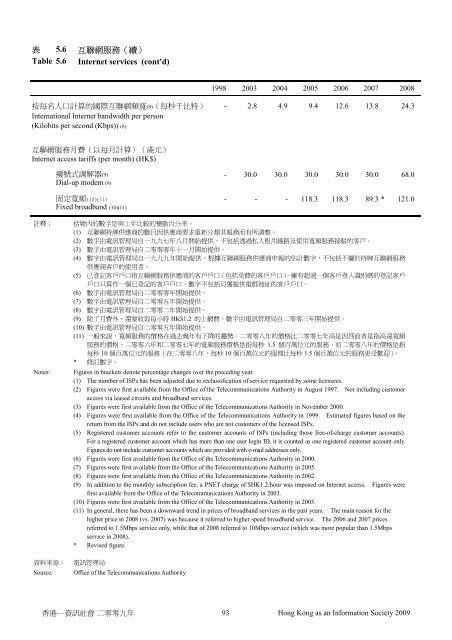
5.6 Table 5.6 Internet services (cont'd)1998 2003 2004 2005 2006 2007 2008(8) - 2.8 4.9 9.4 12.6 13.8 24.3International Internet bandwidth per person(Kilobits per second (Kbps)) (8)Internet access tariffs (per month) (HK$)(9)Dial-up modem (9)Fixed broadband (10)(11)- 30.0 30.0 30.0 30.0 30.0 68.0- - - 118.3 118.3 89.3 * 121.0 (1) (2) (3) (4) (5) (6) (7) (8) (9) HK$1.2 (10) (11) 1.5 10 10 1.5 * Notes: Figures in brackets denote percentage changes over the preceding year.(1) The number of ISPs has been adjusted due to reclassification of service requested by some licensees.(2) Figures were first available from the Office of the Telecommunications Authority in August 1997. Not including customeraccess via leased circuits and broadband services.(3) Figures were first available from the Office of the Telecommunications Authority in November 2000.(4) Figures were first available from the Office of the Telecommunications Authority in 1999. Estimated figures based on thereturn from the ISPs and do not include users who are not customers of the licensed ISPs.(5) Registered customer accounts refer to the customer accounts of ISPs (including those free-of-charge customer accounts).For a registered customer account which has more than one user login ID, it is counted as one registered customer account only.Figures do not include customer accounts which are provided with e-mail addresses only.(6) Figures were first available from the Office of the Telecommunications Authority in 2000.(7) Figures were first available from the Office of the Telecommunications Authority in 2005.(8) Figures were first available from the Office of the Telecommunications Authority in 2002.(9) In addition to the monthly subscription fee, a PNET charge of $HK1.2/hour was imposed on Internet access. Figures werefirst available from the Office of the Telecommunications Authority in 2003.(10) Figures were first available from the Office of the Telecommunications Authority in 2005.(11) In general, there has been a downward trend in prices of broadband services in the past years. The main reason for thehigher price in 2008 (vs. 2007) was because it referred to higher speed broadband service. The 2006 and 2007 pricesreferred to 1.5Mbps service only, while that of 2008 referred to 10Mbps service (which was more popular than 1.5Mbpsservice in 2008).* Revised figure. Source: Office of the Telecommunications Authority93 Hong Kong as an Information Society 2009