香港—資訊社會 - 「數碼21」資訊科技策略
香港—資訊社會 - 「數碼21」資訊科技策略
香港—資訊社會 - 「數碼21」資訊科技策略

Create successful ePaper yourself
Turn your PDF publications into a flip-book with our unique Google optimized e-Paper software.
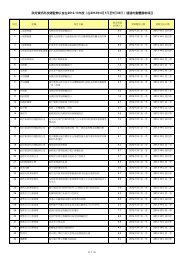
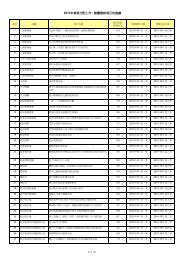
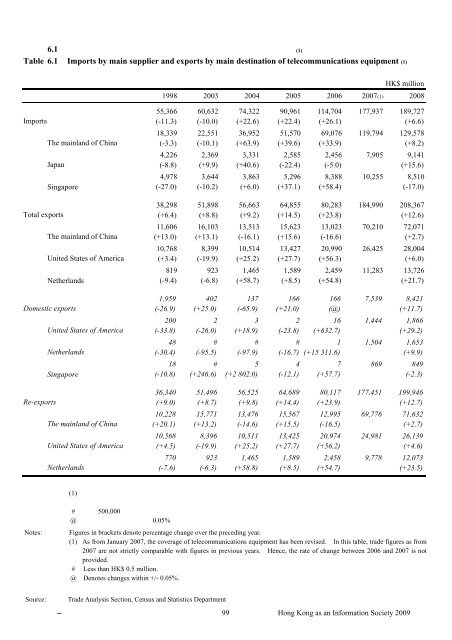
6.1 (1)Table 6.1 Imports by main supplier and exports by main destination of telecommunications equipment (1)HK$ million1998 2003 2004 2005 2006 2007(1) 2008 55,366 60,632 74,322 90,961 114,704 177,937 189,727Imports (-11.3) (-10.0) (+22.6) (+22.4) (+26.1) (+6.6) 18,339 22,551 36,952 51,570 69,076 119,794 129,578The mainland of China (-3.3) (-10.1) (+63.9) (+39.6) (+33.9) (+8.2) 4,226 2,369 3,331 2,585 2,456 7,905 9,141Japan (-8.8) (+9.9) (+40.6) (-22.4) (-5.0) (+15.6) 4,978 3,644 3,863 5,296 8,388 10,255 8,510Singapore (-27.0) (-10.2) (+6.0) (+37.1) (+58.4) (-17.0) 38,298 51,898 56,663 64,855 80,283 184,990 208,367Total exports (+6.4) (+8.8) (+9.2) (+14.5) (+23.8) (+12.6) 11,606 16,103 13,513 15,623 13,023 70,210 72,071The mainland of China (+13.0) (+13.1) (-16.1) (+15.6) (-16.6) (+2.7) 10,768 8,399 10,514 13,427 20,990 26,425 28,004United States of America (+3.4) (-19.9) (+25.2) (+27.7) (+56.3) (+6.0) 819 923 1,465 1,589 2,459 11,283 13,726Netherlands (-9.4) (-6.8) (+58.7) (+8.5) (+54.8) (+21.7) 1,959 402 137 166 166 7,539 8,421Domestic exports (-26.9) (+25.0) (-65.9) (+21.0) (@) (+11.7) 200 2 3 2 16 1,444 1,866United States of America (-33.8) (-26.0) (+18.9) (-23.8) (+632.7) (+29.2) 48 # # # 1 1,504 1,653Netherlands (-30.4) (-95.5) (-97.9) (-16.7) (+15 311.6) (+9.9) 18 # 5 4 7 869 849Singapore (-10.8) (+246.6) (+2 802.0) (-12.1) (+57.7) (-2.3) 36,340 51,496 56,525 64,689 80,117 177,451 199,946Re-exports (+9.0) (+8.7) (+9.8) (+14.4) (+23.9) (+12.7) 10,228 15,771 13,476 15,567 12,995 69,776 71,632The mainland of China (+20.1) (+13.2) (-14.6) (+15.5) (-16.5) (+2.7) 10,568 8,396 10,511 13,425 20,974 24,981 26,139United States of America (+4.5) (-19.9) (+25.2) (+27.7) (+56.2) (+4.6) 770 923 1,465 1,589 2,458 9,778 12,073Netherlands (-7.6) (-6.3) (+58.8) (+8.5) (+54.7) (+23.5) (1) # 500,000 @ 0.05%Notes: Figures in brackets denote percentage change over the preceding year.(1) As from January 2007, the coverage of telecommunications equipment has been revised. In this table, trade figures as from2007 are not strictly comparable with figures in previous years. Hence, the rate of change between 2006 and 2007 is notprovided.# Less than HK$ 0.5 million.@ Denotes changes within +/- 0.05%.Source: Trade Analysis Section, Census and Statistics Department 99 Hong Kong as an Information Society 2009