2.14 Table 2.14 Business receipts received through selling goods, services or information through electronicmeans by type of electronic means used/customer groupHK$ million YearType of electronic means used/Customer group 2003 2004 2005 2006 2007 2008Type of electronic means used 13,680 11,057 8,007 22,054 43,283 72,616Internet (64.6) (40.0) (18.2) (34.0) (44.0) (52.0)[+33.5] [-19.2] [-27.6] [+175.4] [+96.3] [+67.8] 6,440 15,432 34,953 40,830 52,487 62,915Designated private network (30.4) (55.8) (79.5) (62.9) (53.4) (45.1)[+89.7] [+139.6] [+126.5] [+16.8] [+28.5] [+19.9] 1,065 1,067 979 2,021 2,457 3,615Interactive Response System (5.0) (3.9) (2.2) (3.1) (2.5) (2.6)through telephone lines [-46.7] [+0.2] [-8.2] [+106.5] [+21.5] [+47.1] 1.0 76.0 0.0 0.0 160 429Others (#) (0.3) (0.0) (0.0) (0.2) (0.3)[-84.5] [+6 829.8] [-100.0] [-] [-] [+169.1] 21,185 27,632 43,939 64,905 98,294 139,576Total (100.0) (100.0) (100.0) (100.0) (100.0) (100.0)[+35.4] [+30.4] [+59.0] [+47.7] [+51.4] [+42.0]Customer group 8,047 8,747 6,869 21,962 63,790 84,386Consumers (38.0) (31.7) (15.6) (33.8) (64.9) (60.5)[+0.1] [+8.7] [-21.5] [+219.7] [+190.5] * [+32.3] 12,930 18,742 36,901 42,565 33,949 53,792Business and other establishments (61.0) (67.8) (84.0) (65.6) (34.5) (38.5)[+85.3] [+45.0] [+96.9] [+15.3] [-20.2] * [+58.4] 208 142 169 378 555 1,399Government and related organisations (1.0) (0.5) (0.4) (0.6) (0.6) (1.0)[-67.1] [-31.5] [+18.9] [+123.3] [+47.0] [+151.9] 21,185 27,632 43,939 64,905 98,294 139,576Total (100.0) (100.0) (100.0) (100.0) (100.0) (100.0)[+35.4] [+30.4] [+59.0] [+47.7] [+51.4] [+42.0]0.42 0.49 0.64 0.77 1.16 1.69Business receipts through electronic means asa % of total business receipts # 0.05%* Notes: Figures in round brackets denote the percentage shares to their respective totals.Figures in square brackets denote the annual percentage change.# Less than 0.05%.* Revised figures.Source: Science and Technology Statistics Section, Census and Statistics Department58 Hong Kong as an Information Society 2009
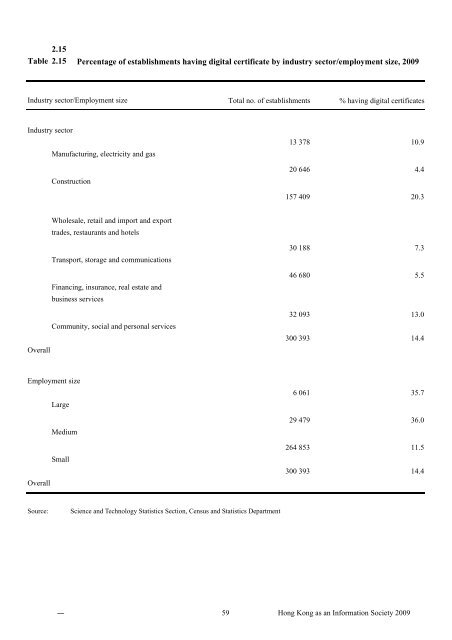
2.15 Table 2.15 Percentage of establishments having digital certificate by industry sector/employment size, 2009Industry sector/Employment sizeIndustry sectorManufacturing, electricity and gasConstructionTotal no. of establishments % having digital certificates13 378 10.920 646 4.4Wholesale, retail and import and exporttrades, restaurants and hotelsTransport, storage and communicationsFinancing, insurance, real estate andbusiness servicesCommunity, social and personal servicesOverallEmployment sizeLargeMediumSmallOverall157 409 20.330 188 7.346 680 5.532 093 13.0300 393 14.46 061 35.729 479 36.0264 853 11.5300 393 14.4Source: Science and Technology Statistics Section, Census and Statistics Department59 Hong Kong as an Information Society 2009