香港—資訊社會 - 「數碼21」資訊科技策略
香港—資訊社會 - 「數碼21」資訊科技策略
香港—資訊社會 - 「數碼21」資訊科技策略

You also want an ePaper? Increase the reach of your titles
YUMPU automatically turns print PDFs into web optimized ePapers that Google loves.
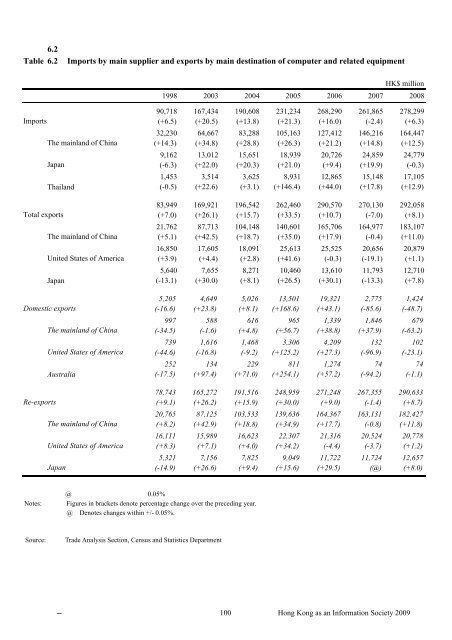
6.2 Table 6.2 Imports by main supplier and exports by main destination of computer and related equipmentHK$ million1998 2003 2004 2005 2006 2007 2008 90,718 167,434 190,608 231,234 268,290 261,865 278,299Imports (+6.5) (+20.5) (+13.8) (+21.3) (+16.0) (-2.4) (+6.3) 32,230 64,667 83,288 105,163 127,412 146,216 164,447The mainland of China (+14.3) (+34.8) (+28.8) (+26.3) (+21.2) (+14.8) (+12.5) 9,162 13,012 15,651 18,939 20,726 24,859 24,779Japan (-6.3) (+22.0) (+20.3) (+21.0) (+9.4) (+19.9) (-0.3) 1,453 3,514 3,625 8,931 12,865 15,148 17,105Thailand (-0.5) (+22.6) (+3.1) (+146.4) (+44.0) (+17.8) (+12.9) 83,949 169,921 196,542 262,460 290,570 270,130 292,058Total exports (+7.0) (+26.1) (+15.7) (+33.5) (+10.7) (-7.0) (+8.1) 21,762 87,713 104,148 140,601 165,706 164,977 183,107The mainland of China (+5.1) (+42.5) (+18.7) (+35.0) (+17.9) (-0.4) (+11.0) 16,850 17,605 18,091 25,613 25,525 20,656 20,879United States of America (+3.9) (+4.4) (+2.8) (+41.6) (-0.3) (-19.1) (+1.1) 5,640 7,655 8,271 10,460 13,610 11,793 12,710Japan (-13.1) (+30.0) (+8.1) (+26.5) (+30.1) (-13.3) (+7.8) 5,205 4,649 5,026 13,501 19,321 2,775 1,424Domestic exports (-16.6) (+23.8) (+8.1) (+168.6) (+43.1) (-85.6) (-48.7) 997 588 616 965 1,339 1,846 679The mainland of China (-34.5) (-1.6) (+4.8) (+56.7) (+38.8) (+37.9) (-63.2) 739 1,616 1,468 3,306 4,209 132 102United States of America (-44.6) (-16.8) (-9.2) (+125.2) (+27.3) (-96.9) (-23.1) 252 134 229 811 1,274 74 74Australia (-17.5) (+97.4) (+71.0) (+254.1) (+57.2) (-94.2) (-1.1) 78,743 165,272 191,516 248,959 271,248 267,355 290,633Re-exports (+9.1) (+26.2) (+15.9) (+30.0) (+9.0) (-1.4) (+8.7) 20,765 87,125 103,533 139,636 164,367 163,131 182,427The mainland of China (+8.2) (+42.9) (+18.8) (+34.9) (+17.7) (-0.8) (+11.8) 16,111 15,989 16,623 22,307 21,316 20,524 20,778United States of America (+8.3) (+7.1) (+4.0) (+34.2) (-4.4) (-3.7) (+1.2) 5,321 7,156 7,825 9,049 11,722 11,724 12,657Japan (-14.9) (+26.6) (+9.4) (+15.6) (+29.5) (@) (+8.0)@ 0.05%Notes: Figures in brackets denote percentage change over the preceding year.@ Denotes changes within +/- 0.05%.Source: Trade Analysis Section, Census and Statistics Department100 Hong Kong as an Information Society 2009