香港—資訊社會 - 「數碼21」資訊科技策略
香港—資訊社會 - 「數碼21」資訊科技策略
香港—資訊社會 - 「數碼21」資訊科技策略

Create successful ePaper yourself
Turn your PDF publications into a flip-book with our unique Google optimized e-Paper software.
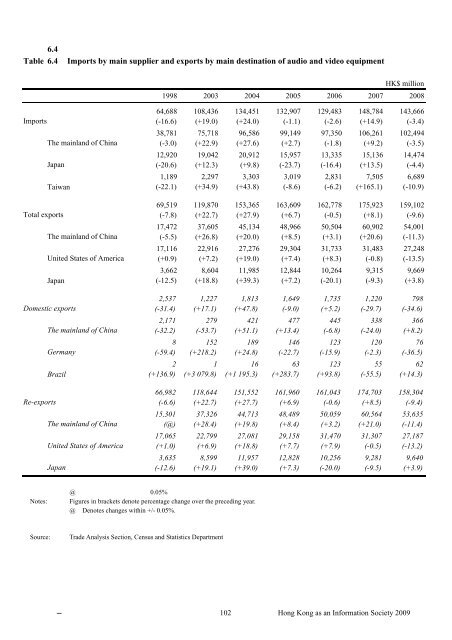
6.4 Table 6.4 Imports by main supplier and exports by main destination of audio and video equipmentHK$ million1998 2003 2004 2005 2006 2007 2008 64,688 108,436 134,451 132,907 129,483 148,784 143,666Imports (-16.6) (+19.0) (+24.0) (-1.1) (-2.6) (+14.9) (-3.4) 38,781 75,718 96,586 99,149 97,350 106,261 102,494The mainland of China (-3.0) (+22.9) (+27.6) (+2.7) (-1.8) (+9.2) (-3.5) 12,920 19,042 20,912 15,957 13,335 15,136 14,474Japan (-20.6) (+12.3) (+9.8) (-23.7) (-16.4) (+13.5) (-4.4) 1,189 2,297 3,303 3,019 2,831 7,505 6,689Taiwan (-22.1) (+34.9) (+43.8) (-8.6) (-6.2) (+165.1) (-10.9) 69,519 119,870 153,365 163,609 162,778 175,923 159,102Total exports (-7.8) (+22.7) (+27.9) (+6.7) (-0.5) (+8.1) (-9.6) 17,472 37,605 45,134 48,966 50,504 60,902 54,001The mainland of China (-5.5) (+26.8) (+20.0) (+8.5) (+3.1) (+20.6) (-11.3) 17,116 22,916 27,276 29,304 31,733 31,483 27,248United States of America (+0.9) (+7.2) (+19.0) (+7.4) (+8.3) (-0.8) (-13.5) 3,662 8,604 11,985 12,844 10,264 9,315 9,669Japan (-12.5) (+18.8) (+39.3) (+7.2) (-20.1) (-9.3) (+3.8) 2,537 1,227 1,813 1,649 1,735 1,220 798Domestic exports (-31.4) (+17.1) (+47.8) (-9.0) (+5.2) (-29.7) (-34.6) 2,171 279 421 477 445 338 366The mainland of China (-32.2) (-53.7) (+51.1) (+13.4) (-6.8) (-24.0) (+8.2) 8 152 189 146 123 120 76Germany (-59.4) (+218.2) (+24.8) (-22.7) (-15.9) (-2.3) (-36.5) 2 1 16 63 123 55 62Brazil (+136.9) (+3 079.8) (+1 195.3) (+283.7) (+93.8) (-55.5) (+14.3) 66,982 118,644 151,552 161,960 161,043 174,703 158,304Re-exports (-6.6) (+22.7) (+27.7) (+6.9) (-0.6) (+8.5) (-9.4) 15,301 37,326 44,713 48,489 50,059 60,564 53,635The mainland of China (@) (+28.4) (+19.8) (+8.4) (+3.2) (+21.0) (-11.4) 17,065 22,799 27,081 29,158 31,470 31,307 27,187United States of America (+1.0) (+6.9) (+18.8) (+7.7) (+7.9) (-0.5) (-13.2) 3,635 8,599 11,957 12,828 10,256 9,281 9,640Japan (-12.6) (+19.1) (+39.0) (+7.3) (-20.0) (-9.5) (+3.9)@ 0.05%Notes: Figures in brackets denote percentage change over the preceding year.@ Denotes changes within +/- 0.05%.Source: Trade Analysis Section, Census and Statistics Department102 Hong Kong as an Information Society 2009