香港—資訊社會 - 「數碼21」資訊科技策略
香港—資訊社會 - 「數碼21」資訊科技策略
香港—資訊社會 - 「數碼21」資訊科技策略

You also want an ePaper? Increase the reach of your titles
YUMPU automatically turns print PDFs into web optimized ePapers that Google loves.
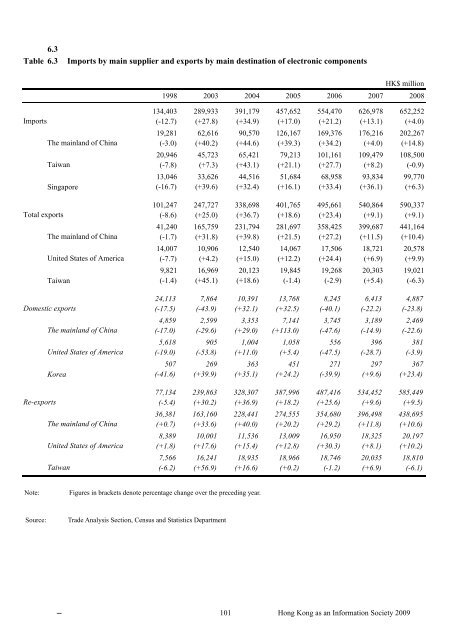
6.3 Table 6.3 Imports by main supplier and exports by main destination of electronic componentsHK$ million1998 2003 2004 2005 2006 2007 2008 134,403 289,933 391,179 457,652 554,470 626,978 652,252Imports (-12.7) (+27.8) (+34.9) (+17.0) (+21.2) (+13.1) (+4.0) 19,281 62,616 90,570 126,167 169,376 176,216 202,267The mainland of China (-3.0) (+40.2) (+44.6) (+39.3) (+34.2) (+4.0) (+14.8) 20,946 45,723 65,421 79,213 101,161 109,479 108,500Taiwan (-7.8) (+7.3) (+43.1) (+21.1) (+27.7) (+8.2) (-0.9) 13,046 33,626 44,516 51,684 68,958 93,834 99,770Singapore (-16.7) (+39.6) (+32.4) (+16.1) (+33.4) (+36.1) (+6.3) 101,247 247,727 338,698 401,765 495,661 540,864 590,337Total exports (-8.6) (+25.0) (+36.7) (+18.6) (+23.4) (+9.1) (+9.1) 41,240 165,759 231,794 281,697 358,425 399,687 441,164The mainland of China (-1.7) (+31.8) (+39.8) (+21.5) (+27.2) (+11.5) (+10.4) 14,007 10,906 12,540 14,067 17,506 18,721 20,578United States of America (-7.7) (+4.2) (+15.0) (+12.2) (+24.4) (+6.9) (+9.9) 9,821 16,969 20,123 19,845 19,268 20,303 19,021Taiwan (-1.4) (+45.1) (+18.6) (-1.4) (-2.9) (+5.4) (-6.3) 24,113 7,864 10,391 13,768 8,245 6,413 4,887Domestic exports (-17.5) (-43.9) (+32.1) (+32.5) (-40.1) (-22.2) (-23.8) 4,859 2,599 3,353 7,141 3,745 3,189 2,469The mainland of China (-17.0) (-29.6) (+29.0) (+113.0) (-47.6) (-14.9) (-22.6) 5,618 905 1,004 1,058 556 396 381United States of America (-19.0) (-53.8) (+11.0) (+5.4) (-47.5) (-28.7) (-3.9) 507 269 363 451 271 297 367Korea (-41.6) (+39.9) (+35.1) (+24.2) (-39.9) (+9.6) (+23.4) 77,134 239,863 328,307 387,996 487,416 534,452 585,449Re-exports (-5.4) (+30.2) (+36.9) (+18.2) (+25.6) (+9.6) (+9.5) 36,381 163,160 228,441 274,555 354,680 396,498 438,695The mainland of China (+0.7) (+33.6) (+40.0) (+20.2) (+29.2) (+11.8) (+10.6) 8,389 10,001 11,536 13,009 16,950 18,325 20,197United States of America (+1.8) (+17.6) (+15.4) (+12.8) (+30.3) (+8.1) (+10.2) 7,566 16,241 18,935 18,966 18,746 20,035 18,810Taiwan (-6.2) (+56.9) (+16.6) (+0.2) (-1.2) (+6.9) (-6.1) Note: Figures in brackets denote percentage change over the preceding year.Source: Trade Analysis Section, Census and Statistics Department101 Hong Kong as an Information Society 2009